
Investor/RT Version 12.0 Release Notes
Released: September 1, 2014

Introducing RTX Extensions

Other Enhancements
- 5 RTL Favorite Tokens.
- 6 Chart Element Manager.
- 7 %TOKEN Usage in Annotations and Reference Line Titles.
- 8 Range Bar and Change Bar Setup Revision.
- 9 Chart Scrolling By Date/Time.
- 10 Unified Preferences Window.
- 11 Keyboard Shortcuts for Chart Buttons.
- 12 Main Toolbar Improved.
- 13 Math Lines Indicator Available as RTX Extension.
- 14 Polynomial Regression Channel RTX Indicator Available.
- 15 Window Manager.
- 16 Version 12 Fixes, Miscellaneous Enhancement.
- RTX: Extension Development Tools
The Investor/RT SDK (Software Development Kit) has been substantially improved and is now an integral toolkit available to all Investor/RT users. The tools are used to build Investor/RT Extensions (formerly called plug-ins). We will use the acronym RTX (RT eXtension) to refer to this new set of tools. The Investor/RT platform contains RTX tools for creating and editing RTX source code, building executable RTX components (DLLs), and adding them to charts. The suite of RTX tools enables consultants, third-party commercial software developers, and Investor/RT users who have basic familiarity with procedural programming to extend Investor/RT with high performance indicators, trading signals, drawing tools and auto trading systems. The name RTX was chosen carefully. RTL is the Investor/RT end-user formula language, the RT Language, used to compose custom indicators and trading signals. RTX is the RT Extensions toolkit used to develop indicators, signals, and drawing tools using C/C++. RTX has been designed to parallel RTL in many ways. References to market data and indicators in RTX development are the same or very similar to the tokens of RTL.
Version 12 of Investor/RT features user interface improvements designed make RTX extensions as easily accessible as built-in indicators. For example, Version 12 has a new indicator called RiskReward (see item #3 below for more information). You can add this indicator to a chart in the customary way using the Add Indicator dialog. Select RiskReward, specify the preferences, and click to add the indicator to the chart. This indicator is also a drawing tool; thus it can be added to a chart by right-clicking and choosing Draw > Risk/Reward Drawing Tool. The indicator operates just as built-in indicators do, but RiskReward is, in fact, an RTX Extension. Sample extensions for customized stochastics and balance of power indicators are also provided with Version 12 along with source code to illustrate the ease with which new indicators can be created using RTX tools.
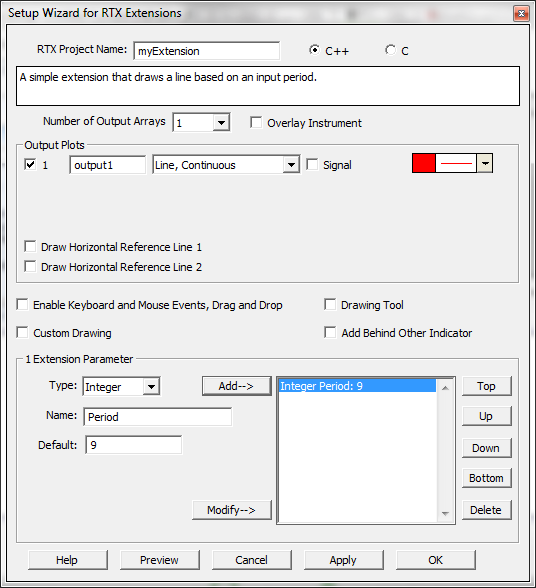
The RTX Setup tool is used to automatically create source code for a new RTX Extension. Choose File > New > RTX Extension. Specify a name for the extension, describe its properties (its outputs and any parameters (preferences) the extension will have) and click OK. Investor/RT will then create a complete source program (a C++ source file).
All extensions you create and sample extensions installed by the product installer are managed by the Object Manager just like other types of objects such as charts and quotepages. Use File > Open > RTX Extension to view all your extensions. Select one or more and click Edit to edit the source code; click Build to build the selected extensions. The notepad++ code editor, customized for RTX, is built-in to the Investor/RT installation. This powerful code editor features syntax highlighting and a full auto-completion dictionary of RTX keywords and function names.
We have prepared a Video Walk-through illustrating how these tools are used to build a complete executable indicator in minutes with minimal programming expertise required. Since most of the source code is auto-generated by the RTX Setup tool, the programming required for many indicators is principally the calculation logic for each bar.
For consultants/programmers, commercial developers and Investor/RT users with programming skills, RTX empowers the developer with access to market data, powerful analytics and a robust API:
- Access Investor/RT built-in indicators.
- Access market data for any symbol(s) being tracked by Investor/RT.
- Access bar data for the instrument associated with the extension: open, high, low, close, volume, date/time, buy volume, sell volume, buy/sell/total volume for each price within intra-day bars.
- Robust Drawing Tools: text, lines, rectangles, circles, ovals. Drawing location determined by bar number and price value.
- Line drawing in various styles and line thicknesses. Filling rectangles and other shapes with any desired color. Translucent drawing
- Mouse movement and mouse click events within the pane. Mouse clicks to select the indicator can be done by Investor/RT or by the extension itself.
- Monitor keyboard activity when the extension is the selected indicator in the chart.
- Trading API. Extensions can trigger trading orders by name.
- Place buy or sell market, stop, limit or stop/limit orders at computed prices or prices determined from user clicks or setups.
- Cancel working orders, flatten a position for a specific symbol, flatten all positions.
- Current position size and working order status to automate trading, stop and target management, etc.
- Get or set V# user variable(s) for any symbol(s) tracked by I/RT to feed display of data in quotepages or to place computed results into variables for use by other extensions or RTL indicators and signals.
The RTX development tools require an Investor/RT license. The RTX build tool utilizes Microsoft Visual Studio/C++ (Express or Professional). Instructions for installing the free Visual Studio Express software and configuring it for use by Investor/RT are available in our Knowledge Base.
- New linnsoft.com Web Site

Linn Software is pleased to announce its new web site, www.linnsoft.com. The new site is powered by a state-of-the-art content management system that provides the company with a solid foundation for delivering high quality content to our customers and prospective customers. The site is designed to facilitate interaction and sharing. Users who login as authenticated subscribers can view billing, license and subscription information and make revisions to licenses at the online store. The site is optimized for mobile, enabling viewing of videos and other content on tablets, smartphones and the desktop. The Revise License button in the File > License... window will direct you to linnsoft.com to view/edit your subscription. After making a change to your license at the linnsoft.com store, De-Activate and Activate the license again to get the revised features.
- RTX: Risk Reward Tool
The Risk Reward indicator is a rectangular drawing tool that studies a range of trading, showing how profit target and stop loss settings would have played out has you entered the market at some base price. For more information see the Risk Reward indicator. The Risk Reward tool is an example of a sophisticated indicator/drawing tool developed by Linn Software using the same RTX tools available to users of Investor/RT.
- RTL Favorite Tokens
The RTL setup window now allows the user to setup a list of often used favorite tokens.
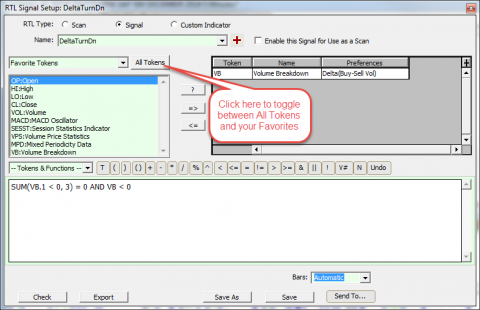
By default, tokens OP,HI,LO,CL,VOL,SESST,VPS,MPD appear in the Tokens and Function list above the formula entry box. Use Setup > Configuration > RTLFavoriteTokens to create your own favorites list. For example, set:
RTLFavoriteTokens=BOLU,BOLD,MACD,KELTU,KELDif you often use Bollinger Bands, MACD, and Keltner Bands in your RTL formula so that these tokens are selections from the menu to add the selected token at the cursor into your formula.Click the Favorites button at the top to show only your favorite RTL tokens in the topmost list at the left.
- Chart Element Manager
Right-click in a multi-pane chart and choose Element Manager... or simply double-click inside the chart window to open the Chart Element Manager window.
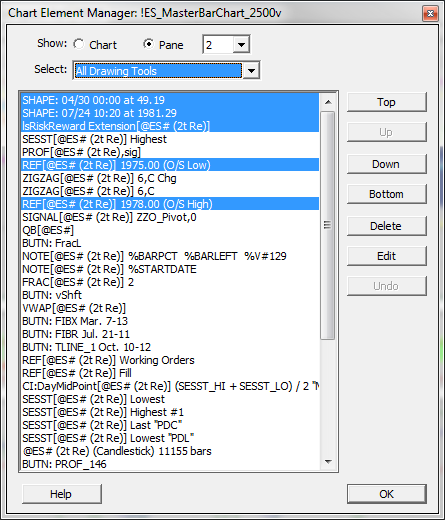
This window provides a list of graphic elements in the entire chart or in a specific pane. When working with a specific pane, you may arrange the elements in drawing order. Using this window, you may select one or more elements and delete them. You may select an element and click Edit to revise its preferences (double-clicking an element name does the same). You can use the selection assistant menu to select a subset of the listed indicators, e.g. select all buttons, or all indicators that have associated drawing tools. You can select multiple elements in the list by shift-click or ctrl-clicking to pick non-adjacent elements. Then click Delete to remove them from the chart.
- %TOKEN Usage in Annotations and Reference Line Titles
The Annotation Indicator and the Reference Line indicator enable the text of the annotation or reference line title to contain RTL tokens, string replacement tokens, where the text of the note or title shows the expanded text. For example, an annotation setup as "%TICKER %CL at %NOW" will appear in the chart as say "@ES# 1994.25 at 10:53:06". The tokenized values update as the last trading price and time of day change over time. If you change the instrument in the chart, the %TICKER token updates so the note begins with the new symbol followed by its price and the time of day.
In version 12, two tokens for displaying date time and have been added, %DTHM showing the abbreviated month and day followed by the time of day in hh:mm format. If seconds are of interest, use %DTHMS instead.
The processing of %TOKENS in these two indicators has been enhanced to enable the user to specify that some tokens are to be expanded only once, when the indicator is added to the chart and subsequently remain static. This is especially useful for example, if you wish to add time stamped notes to a chart window where the time you added the note is a token like %DTHM that expands to the date/time when the note is added and remains fixed thereafter. This is accomplished by enclosing any span of text in the annotation text in brackets, like this:
[%DTHM- This is a time-stamped note]Any %TOKENS inside the brackets are expanded once and only once. Any %TOKENS outside the brackets are treated in the customary way, updating dynamically based on the time of day, market data, ticker symbol, etc.
An interesting usage scenario for this new feature is using the bracketed notation in the default preferences for horizontal reference lines. Setup your default title for ref lines to be [%DTHM] for example. Then, whenever you use the Investor/RT reference line drawing tool to lay down a line, the title of the line will show the date/time when the line was put into the chart for future reference.
You can setup a button to invoke the annotation drawing tool where the annotation drawing preset preferences call for the text
"[At %DTHM, Value was %V#33]. Value now %V#33"where user variable V#33 is some value that is updating continuously via RTL elsewhere in the chart. You can click the button to activate the drawing tool; then click into the chart to place the notation. The note will then tell you the date/time it was added to the chart and the value of V#33 at that instant, followed by the current value of V#33 as it continues updating. - Range Bar and Change Bar Setup Revision
Investor/RT Version 12 and higher adopts the convention that the size of the range or change of each bar be expressed as the number of tick increments of range or change. In Version 11, range/chart bar periodicity has been expressed differently, as the number of prices within the range bar, a number that is one greater than the number of tick increments in the range.
Upon upgrade to Version 12, Investor/RT will search for and adjust the periodicity of any charts and trading systems that call for Range or Change Bars. If you have one or more charts/trading systems using this periodicity, you will be notified at startup that adjustments were made.
- Chart Scrolling By Date/Time
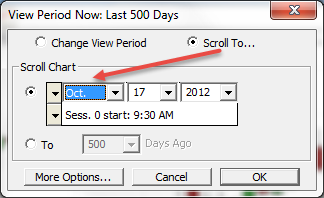
With a multi-pane chart window open, pressing the period key on the keyboard brings up a window for quickly adjusting the starting date of the chart. This handy window has been extended to enable scrolling to some date/time. Press period and select the Scroll To... radio button to begin. Then, specify a specific date using the date entry control, or specify a number of days ago and chart will scroll to bring that date/time into view. As you adjust any property of the date/time for days ago, the chart scrolls. Thus you can position the cursor in the month for example and use the up/down arrow keys to move forward or backward one month at a time, each key press bring the new date into view. This feature is very handy when viewing long term intra-day or daily charts.
- Unified Preferences Window
The File > Preferences menu item and the Preferences icon on the main tools now opens a unified preferences window showing preferences topics listed by category. Categories can be expanded or collapsed; view any preferences topic of interest with a single click. A convenient search box at the top will list all preferences topics that match an entered keyword or string of characters. For example, enter the word "chart" and only preferences topics related to charting will be listed for selection. This user interface improvement makes preference setting easier and more accessible, all within a single window.
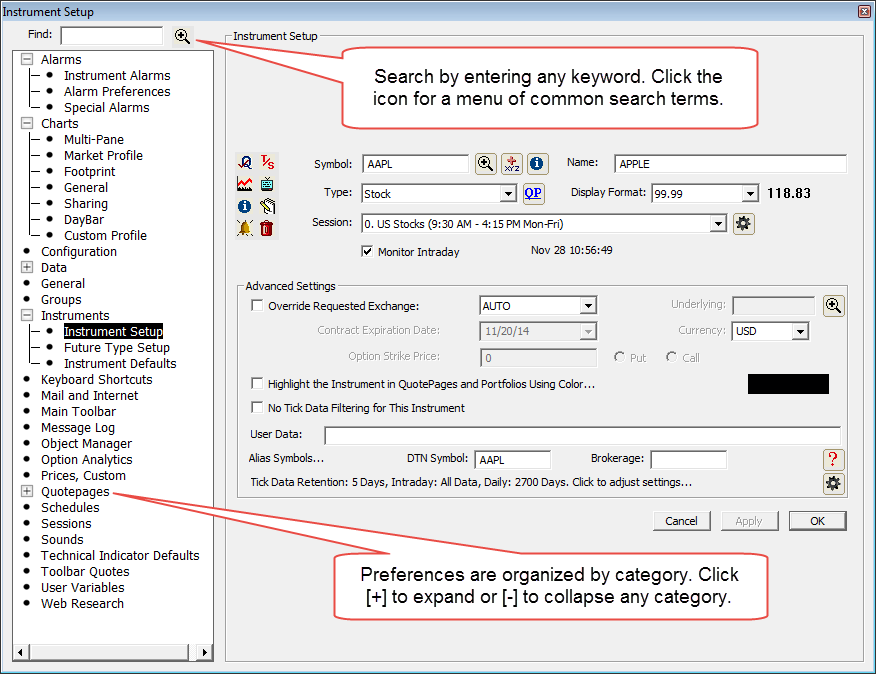
Choosing File > Preferences (Alt+Y) opens this window, as does clicking the Preferences button on the main toolbar (the gear icon). If you Ctrl-Click on the Preferences button an alphabetized list of preferences topics appears for selection, similar to Version 11.
The unified preferences generally makes the legacy Setup Menu unnecessary. All preferences panels, including instrument and alarm setup are available within the unified window.
The Version 12 menu bar has been simpliled to five menus: File, Edit, Data, Window, and Help. Users who prefer to retain the legacy Setup Menu can configure Investor/RT 12 by setting the configuration variable LegacySetupMenu to true and restarting Investor/RT.
A common use of the legacy Setup menu in Version 11 is the Setup > Instruments menu item. The instruments setup window is available in the unified preferences window as seen above. As in Version 11, it can also be opened with the keyboard shortcut Alt+A (Command+A on Mac OS X) or you can right-click in any chart and choose Instrument Setup from the contextual menu. If you elect to reinstate the legacy Setup menu in your configuration, the familiar Setup > Instruments menu item and a host of other commonly referenced preference topics will be accessible from the main menu bar as in Version 11. While all of these are equally accessible within the unified Preferences window, the legacy menu may be preferrable to some because these menu items open the requested preferences as a compact window instead, bypassing the larger unified Preferences window.
- Keyboard Shortcuts for Chart Buttons
Chart Buttons in Investor/RT are one of the most powerful customization features of the platform, enabling you to create menu buttons and push buttons to invoke a wide variety of useful functions with a single-click or menu selection in your charts. Version 12 extends this capability to the keyboard, enabling you to associate a keyboard function key shortcut with any chart push button. For example, say you have a button named "ZIGZAG" inside a chart named "myChart". This button adds/removes (toggles) a Zig Zag indicator on/off in the chart. Go to File > Preferences and select Keyboard Shortcuts. Specify F2 as the function key, and choose Execute > Chart Button as the action. Investor/RT will show you a list of buttons in your open charts. Pick "myChart;ZIGZAG" and click OK to associate the F2 function key with that button. Thereafter, whenever the chart named "myChart" is open, you can press F2 to toggle the zigzag indicator on/off in that chart window.
Keyboard shortcuts can be assigned to any push button in any of your charts. Menu buttons are excluded at present. Most users have keyboards with function keys F1 through F12. Shortcuts can be created for these 12 function keys alone, or those keys with either the Shift or Ctrl key down (or both). Thus up to 48 unique function key shortcuts can be defined.
This enhancement to keyboard shortcuts opens up endless possibilities to perform repetitive tasks with a single keystroke instead of mouse movement and clicking. Using a programmable keypad with relegendable keys in concert with chart buttons and the keyboard shortcut features of Investor/RT, you can further customize your trading workstation. For example, Fentek Industries (www.fentek-ind.com) offers 24-key to 80-key relegenable keypads at prices from $85 to $200. These keypads support mappings of F1 through F24, doubling the number of unique function key shortcuts Investor/RT can handle to 96. Keypads are available with clear keycaps to protect the legends and let you find your shortcuts with a glance. Preprinted and blank legend sheets make it easy to add legends to each key on the keypad.
Here are just a few examples of things you can do with a single keystroke, using your regular keyboard Function keys or a custom keypad:
- Switch to a particular Investor/RT layout.
- Open or close a particular chart or quote page.
- Execute the button purpose of a specific button in a specific chart.
- Execute a trading order within a specific chart.
- Execute (run) any multi-step Investor/RT schedule.
See File > Preferences > Keyboard Shortcuts and explore the Action menu to review hundreds of additional possibilities.
- Main Toolbar Improved
Main Toolbar buttons may be easily customized to provide single-click access to windows and features that you use often. Customization is done by going to File > Preferences: Main Toolbar. Check off the buttons you wish to appear on the toolbar. The Setup Symbols, Session Setup, and Configuration Variables buttons provide quick access to commonly used preferences. The Select Layout button, new in Version 12, provides a quick way to move to a different layout. It does not require that the layout toolbar be open. The Request Support button opens the Linn Software web site where you can search the knowledge base before opening a support ticket. This is the recommended method of obtaining support rather than using email. Answers to many questions can be found directly at the support portal, if not, reviewing potential answers can often help you in formulating a support ticket.
- Math Lines Indicator Available as RTX Extension
The Math Lines indicator has been rebuilt as an RTX Extension. The Math Lines installer is available for downloading. Login to the site is required to access the installer. Click Sign up to create a web site user account at the site. The Math Lines (RTX) indicator is similar in functionality to the older version built into Investor/RT but has more flexibility to specify line color, style, and thickness for each of the support/resistance lines drawn by the indicator. If you use the Math Lines indicator, changing over to the RTX implementation is recommended. All future enhancement of this indicator will be done in RTX and new versions may from time to time appear on the web site. One of the key advantages of RTX Indicators is that they may be improved independently of Investor/RT release cycles. New RTX indicator version updates can be installed without updating Investor/RT itself. For more information and to download the latest installer, see Math Lines.
- Polynomial Regression Channel RTX Indicator Available
This RTX Extension draws a best fit n-degree polynomial regression line through a recent period of data. The user may choose between 1st and 6th degree and may specify the recent period in any number of bars. Bands are drawn above and below the regression line between two user-specified multiples of standard deviation. These bands self adjust for volatility. The installer for this indicator is available for downloading. Login to the site is required to access the installer. For more information and to download the latest installer, see Polynomial Regression Channel.
- Window Manager
The Window > Bring to Front sub-menu item has been superseded by the Window Manager menu item. Selecting Window Manager opens a small window that shows the current state of all visible windows. Optionally, hidden windows that belong to inactive layouts can be included in the list by checking a box. Selecting a window brings that window to the front. Other buttons are provided to Identify the selected window with a window tremor, Close the window, Minimize the window, or Center the window. The Window Manager window floats above the current active layout without being a member of it. The window updates automatically as you change layouts or if you open windows using the Object Manager. Clicking the Refresh button will refresh the list of windows as needed to show current state, current window title, etc. Shift-clicking a window in the list brings the window to the front and identifies it (tremor). Ctrl-clicking a window brings the window front and centered in the main Investor/RT task window.
- Version 12 Miscellaneous Enhancements
- RTL token BARPCT was added. This token has long been available for use in annotations using %BARPCT in the annotation text setup. The token is now available for use inside RTL formulas. It produces a number from 0 to 100 indicating the percentage complete of the current bar being formed in real-time.
- Tokens %DTHM and %DTHMS were added for use in Annotations and other text displays where an abbreviated date and time stamp is needed.
- In multi-pane and TPO Profile charts, the right-click popup menu has been simplified. The Download Data menu item, seldom needed with backfill automation introduced in version 11, now has three choices: Current Session. Last 2 Sessions, and Full Data. At the lower right corner of the chart, clicking in the download icon pops up a menu with these backfill choices.
- Session Statistics indicator has a new statistic: "Minutes Into Period". Similar to "Bars Into Period" that has been available for some time, this statistic returns the number of minutes into period specified by the user (session, week, month, etc).