Homework, Research, and Statistics
This chart was uploaded by Investor/RT 15.1.10 showing symbol: @ES#.
Where does price go based on where price opens?
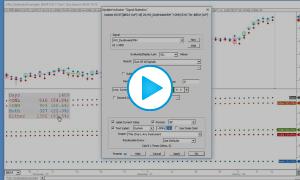
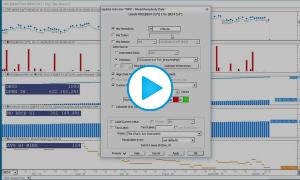
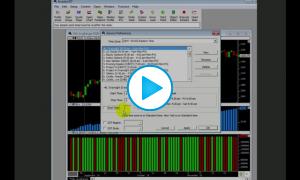
The Homework (HW) RTX Indicator is designed to compute and accumulate price-based statistic on daily data. The indicator is focused on percentages of touching or closing above key prices based on the where price opens the day session. The statistics are placed in buckets based on opening positions of Higher Outside Range (HOR), Higher Inside Range (HIR), Lower Inside Range (LIR) or Lower Outside Range (LOR).
This chart was uploaded by Investor/RT 15.1.4 showing symbol: @ES#.
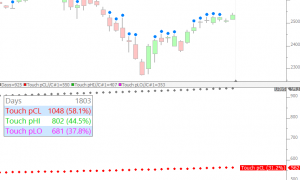
Counts the number of days that price touched the prior close. In our study, price touched previous close on 1048 of 1803 days (58.1%). This chart was uploaded by Investor/RT 15.1.7 showing symbol: @ES#.
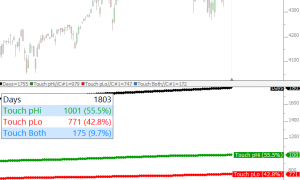
How often did we touch previous days high, low, or both looking at the ES Day Session only. This chart was uploaded by Investor/RT 15.1.1 showing symbol: @ES#.
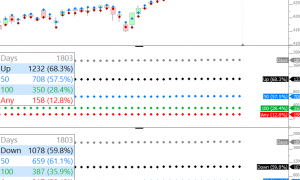
Percent of days IB range was extended up or down, and how often when extended up or down, it extends 50% and 100% in the same direction. Use the Any button at top to enter a custom percentage. This chart was uploaded by Investor/RT 14.2.7 showing symbol: @ES#.
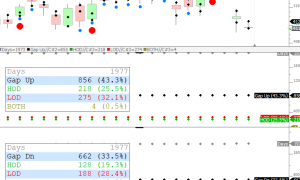
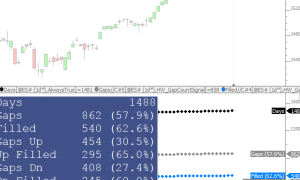
Gap Up and Gap Down Days. How often is the HOD and LOD created in first X minutes on days that gap up or down. Gap (in ticks) and X Minutes both controlled by buttons at top. Gap is day sesison open vs previous day session close. This chart was uploaded by Investor/RT 14.2.6 showing symbol: @ES#.
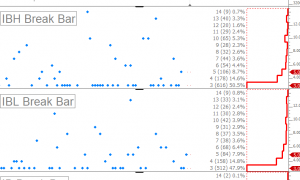
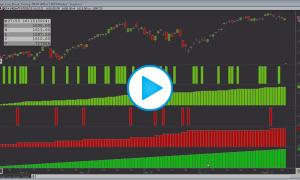
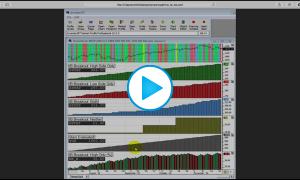
Chart identifies which bar or bracket FIRST breaks the Initial Balance. 2nd pane identifies which bar first breaks the IBH (3 represents 3rd 30-min bar or 3rd bracked or C Bracket - Also 1st bar following the completion of IB). 3rd pane identifiees which bar/bracket first breaks the IBL (Initial Balance Low = low of 1st 60 minutes of day session). And the 4th pane identifies which bar/bracket first broke out of the IB (either direction).
The day session high and low of each day of the week is extended through the week until it resets on same day of week on following week. This chart was uploaded by Investor/RT 14.2.6 showing symbol: ESH1.
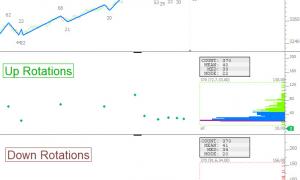
This chart identifies market moves, plots the size of the up moves (or rotations) and the size of the down moves, and providies various statistics on these up and down moves (mean, median, and mode). Filters are available for both day of week and time of day.
This chart was uploaded by Investor/RT 14.1.5 showing symbol: @ES#.
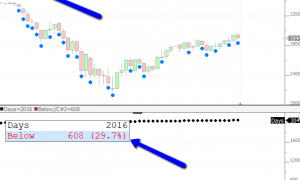
The chart below counts the number of times price closed below a fib level and presents along with the percentage of all days. In this case, of the past 2016 days, the price closed below the 61.8% retracement level 608 times or 29.7% of the past 2016 days. The Fib level is computed from high to low of the same day (61.8% levels would be closer to the low than high). This translates to closing in the bottom 38.2% of the range 29.7% of the time. Use the bottom at the top of the chart to dynamically adjust the Fib Level to any number > 0 and <= 100.
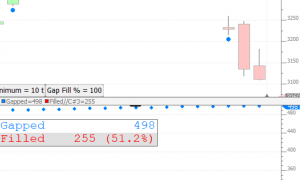
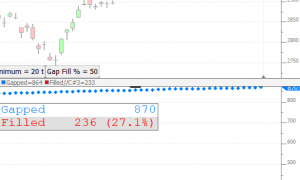
Homework - Gap Zone Fill Stats. Use buttons to provide the minimum gap required to be considered. Use 2nd button to provide the percentage of that gap that must be filled. Gap Zone refers to gap from previous high/low to open. This chart was uploaded by Investor/RT 14.1.12 showing symbol: @ES#.
Chart measures percent of gaps that are filled with buttons to control the minimum gap (in ticks) and the percent of that gap it must fill. This chart was uploaded by Investor/RT 13.6.1 showing symbol: @ES#.
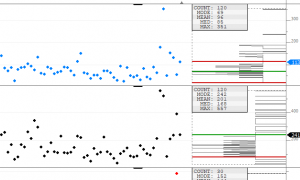
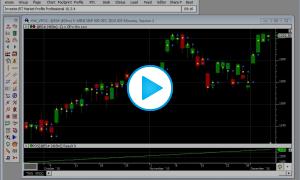
This chart plots the time of day (minutes into session) that the high and low was made each session. It then profiles those values to accumulate the number of times that high and low was made in each time period, and identify the Mode, Mean, and Median. Chart definition is included below.
Chart Definition: https://www.linnsoft.com/charts/newhighlowminutesin-es
Day Change Lookback - Compare today's Day Change price movement from open with that of any past days. Use the buttons at top to control the number of days back (2 overlays).
This video demonstrates how to implement a homework study which counts the number of times the day session high and low broke outside of the overnight session range, and present these values as a percentage of all days. The chart computes the number of times price broke above ONH, below ONL, Both, and Either. The following chart was used in the video.
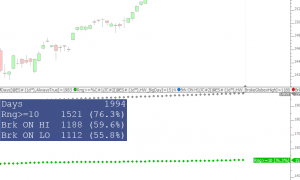
Homework. Number of Big Days (Use Button For Min Range), and Number of Days we break overnight high and low (with percentages). This chart was uploaded by Investor/RT 13.1.1 showing symbol: @ES#.
Gap Statistics Expanded - Count of gap days and how often those gaps were filled. Buttons control minimum gap, maximum gap, and number of minutes into session it must be filled. This chart was uploaded by Investor/RT 13.1.1 showing symbol: @ES#.
Homework - IB Break and Close Stasitics
Chart definition. https://www.linnsoft.com/charts/hw-ib-statistics-es
The statistics are as follows...
IBH = Initial Balance High = High of first 60 minutes of day session.
IBL = Initial Balance Low = Low of first 60 minutes of day session.
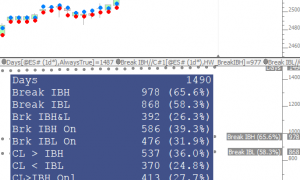
The statistics in the chart below were created using 1441 days ending 10/16/2017. Day session only data on ES.
The results are expressed in percentages. For example, the Break IBH 65.6 tells us that 65.6% of the 1441 days the broke above the IBH at some point during the session.
Break IBH - Broke... Read more
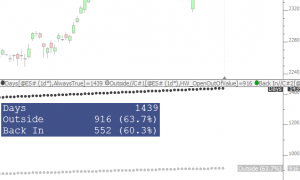
Homework: Opened outside value 916 of 1439 days (64%). Moved back inside value 552 of 916 days (60%). This chart was uploaded by Investor/RT 12.7.1 showing symbol: @ES#.
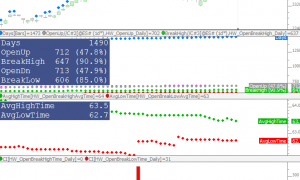
This study looks at an opening period, in this case 30 minutes (configurable using button at top of chart). If the close of the opening period is above the open (up for 1st 30 minutes) then we count how often it price breaks the high of the period during the remainder of the session and look at the time of day it broke that high. On the other side, we look at days that closed down during that opening 30 minute period and count how often price broke that low during the rest of day and record the time of day it broke that low. In the chart below we are looking at the ES day session (... Read more
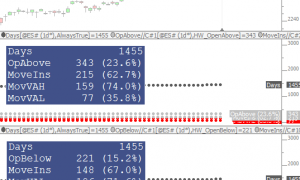
Open Outside Range - Move Inside Range - Move to opposite VAH/VAL. This chart was uploaded by Investor/RT 12.7.1 showing symbol: @ES#.
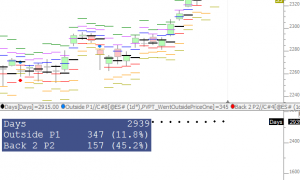
This following chart makes it easy to analyze movements from one pivot point level to another: https://www.linnsoft.com/charts/hw-pivotmoves-es
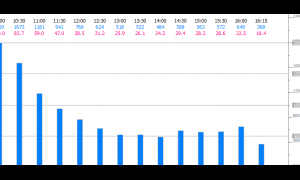
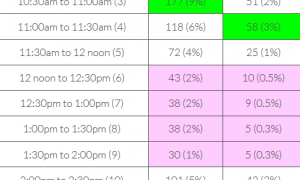
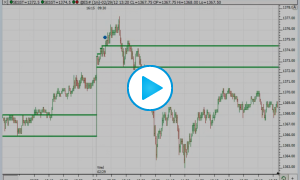
How often is the range extended in each 30 minute period (or "bracket")? This chart provides the answer. The snapshot and table below reflect 2000 days on the ES ending 01/19/2017. Results are reflective of day session only. Each 30-minute bar is labeled with the ending time of bar (in black), number of times range expansion occurred during that bracket (in blue) and the percent of the 2000 days range expansion occurred during that bracket (in pink). During the 1st bracket of the session (9:30am to 10:00am ET), r
This chart helps to identify the 30 minute period within the day session that had the highest range and volume, and accumulates that information over a 2000 day period. The button at the top dictates which 30 minute period the chart is analyzing (1 for 9:30am to 10:00am ET, 2 for 10:00am to 10:30am ET....13 for 3:30pm to 4:00pm ET, etc).
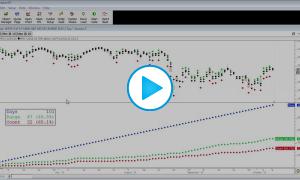
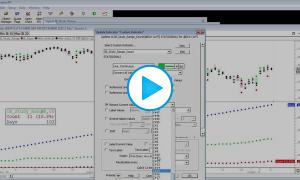
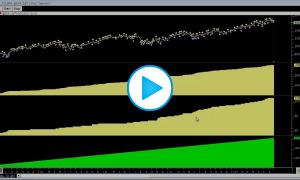
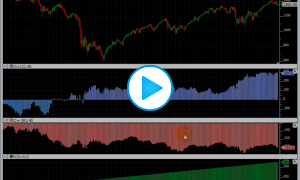
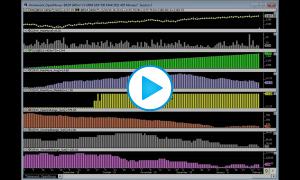
This chart accumulates the change by time of day, dividing the session into 3 130 minute periods (9:30am to 11:40am in blue, 11:40am to 1:50pm in gold, 1:50pm to 4:00pm ET in red). The middle pane shows the per day change for each respective time period. The bottom pane accumulates those per day changes. Chart is currently set to view last 250 days but view period may be adjusted to any period of time. This specifc chart tells us that during 2016 (250 trading days), The cumulative change for the 9:30am to 11:40am peri
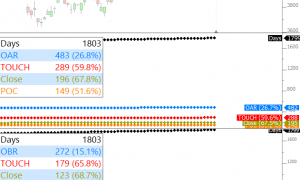
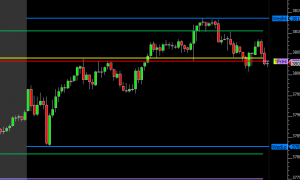
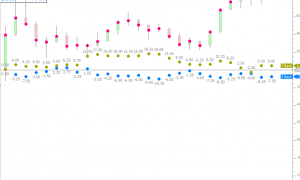
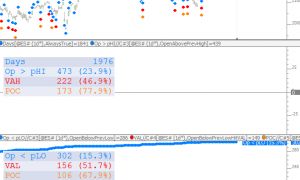
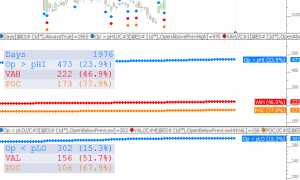
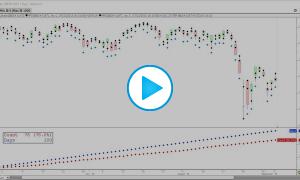
In top pane, the dots above represent days when opening above previous high. Blue dots signal opening above previous high. Red dots signal opening above previous high and returning to previous VAH. Orange dots signal opening above previous high and returning to previous POC. The dots below represent days when opening below previous low. Blue dots signal opening below previous low. Red dots signal opening below previous low and returning to previous VAH. Orange dots signal opening below previous low and returning to previous POC.
Statistic on days that opened outside of previous day range. If opening above range... How often did price return to the VAH? How often did price return to POC? If opening below range... How often did price return to VAL? How often did price return to POC?
In this video, Homework #27, we look at how often price opens inside/outside of previous day session range and overnight range. From there, we explore how often it breaches the high or low and how long it takes each day, and on average, to breach that high or low.
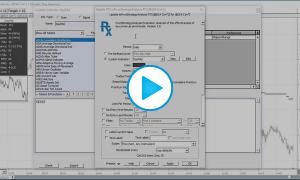
In this video, Homework #26, we explore the effectiveness of key daily price levels and study how price reacts to these key levels, accumulating reaction data over any user-specified period of time. The RTX Indicator Pivot Strategy Analysis (PSA) is an extremely powerful indicator that is custom made to simplify this type of analysis. In this video, we take a look specifically at how price reacts to the day session midpoint. We also explore the use of the Pivot Strategy Optimizer indicator for optimizing variables such as reset distance, target, and stop.
In this webinar Chad Payne, Senior Software Engineer at Linn Software covers a variety of new features built into the latest version of IRT. Chad has worked closely with FuturesTrader71 for approximately 10 years now to continue to develop and evolve the software to the needs of all traders who use Investor/RT including new profile indicator features and many more enhancements to the software. The key goal of this Convergence Event was to focus on how traders can obtain key market behavioral information dynamically using Investor/RT.
In this Video (#24 in Homework, Research, and Statistics series), we study the range of the 30 minute period prior to the session open and explore how often it's engulfed by the following day session as well as by the 1st 30 minute period of the day session. In our study, we learned that of the prior 1000 days (prior to 1/12/15), 77% of the time the the pre-30 bar was completely within the day session range. The pre-30 bar was completely within the 30 min bar of the day session 52% of the time.
In this video, Homework #23 in the video series Homework, Research, and Statistics, we identify the frequency with which any given retracement level of the previous day lines up with any given retracement level of the current day. For instance, how often did the 125% retracement from previous high line up with the current low? How often did the previous day midpoint line up with current high? How often did the previous high line up with the current high.
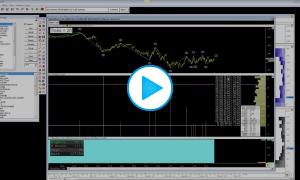
In this video, Homework #22 and Lesson #6 in "Extracting Market Behavior" series, we explore how to filter distributions to help identify sequential relationships in data. Specifically, we look at the day session change, and evaluate the effect of the overnight change on the day session change. For instance, if we had a very positive overnight session, what did the distribution of the day session change look like? What was the median, the mean, the mode, etc. If we had a very negative overnight session, how did that effect the day session change?
This video, the 21st video in the series Homework, Research, and Statistics, is a follow-up to Video 20 and describes how to count how often price ran through key levels (ONH, ONL, pHI, pLO, etc) in addition to counting how often price bounced off these key levels. The definitions for the 2 charts used in this video are shared below.
This video, the 20th video in the series Homework, Research, and Statistics, demonstrates a method for measuring the effectiveness of various key prices as reversal prices or pivot points. Key prices might be overnight high, overnight low, previous high, previous low, etc. It measures their effectiveness by counting the number of times price reversed the following day/session at these prices using the endpoints of the Zig Zag indicator.
This video, lesson 5 in the series on extracting market data, focuses on the statistics available in the Info Box of the Profile Indicator and explains their relevance when applying profiles to indicators.
This video, lesson 4 in the series on extracting market data, focuses on filtering the data that is profiled using in the Profile on Indicator concept. Expanding on the Initial Balance them, we filter the initial balances profiled to only that's that followed an previous initial balance that fits within our specified range. For example, what was the initial balance profile on days that followed small initial balance days (< 5) or what was the initial balance profile on days following large initial balance days (> 12).
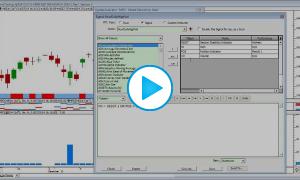
In this video, lesson 3 on extracting market data, we explore the powerful concept of profiles on indicators. Specifically, we extracted the initial balance range from each day and profiled that initial balance. With this profile, we were able to identify how many days the initial balance range fell into various levels (of the past 1000 days, 601 days the range fell between 5 and 10 points, 223 days it fell between 10 and 15 points, etc).
In this video, lesson 2 on extracting market behavior, we expand on lesson one in which we learned how to extract and accumulate initial balance data from daily bars. In this video we take a closer look at the process of creating the signals and custom indicators from scratch while computing the number of days in which the IB range requirements were met. Lessons 1 and 2 have been especially helpful at learning how to extract intraday-based data from daily bars and accumulating that data into meaningful statistics.
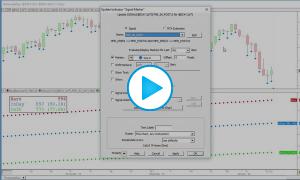
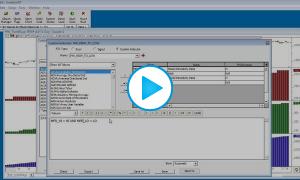
This video explains how to use the Mixed Periodicity Data (MPD) Indicator to extract intraday conditions from daily bars, and how to then use signals and custom indicators to accumulate that information and present it as a percentage of all days. In this case, we look specifically at how many days price reached the 1.5 IBH or 1.5 IBL and present that accumulated number as a percentage of all days studied.
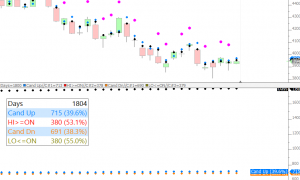
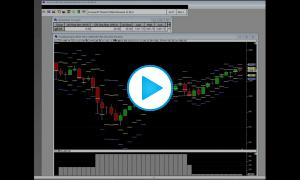
In this video, we will look at the timing of certain events within the day. Specifically, we will look with daily bars at when the high and low of the day occurred, and color the bars based on which occurred 1st. We will also look at how to time other events such as where within the day the bar with highest volume occurred.
In this video, we are looking at the 30 minute period following the Initial Balance (1st 60 minutes of session). During this 30 minute period, we are looking for price to move outside the initial balance and back into it. When this occurs, we are then looking to see if price traveled the full Initial Balance to the other side, before the session is over.
This video focuses on the time of day at which price breaks above the overnight high or below the overnight low during the day session. We'll look at how often these breaks occur in the 1st 10 minutes of the day session, the 2nd ten minutes, and so on for each of the 41 10-minute periods of the day session. We'll do the same for 1-minute, 2-minute, 5-minute, and 30-minute intervals.
This video looks at days where the high was made in the first 60 minutes and the low was made in the last 60 minutes, or visa versa. Of the 1900 days tested, 257 days made a high in the first 60 minutes and a low in the last 60 minutes. 372 days made a low in the first 60 minutes and a high in the last 60 minutes.
Trend Days Chart Definition
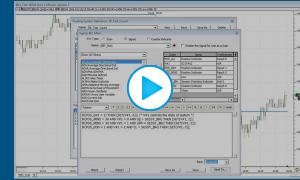
This video describes how to flexibly produce statistical results using Trading System Tools. This method can be especially beneficial when several events are required to occur sequentially within a day or session. In this specific example, we look fro price to trade above the Initial Balance High (IBH), then retest then IBH. We then count the number of times these events occurred and priced closed above the IBH or below the IBH. The definition for the Trading System featured in the video can be downloaded below.
This video compares the change in price by day of week and accumulates this data over a 600 week period.
This video discusses the how to setup chart to monitor and track the opening range trades.
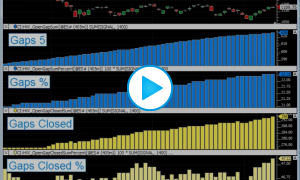
How often does price gap up or down on the ES? And when it does, how often is that gap closed.
Gap Statistics Chart Definition Gap Statistics Plus Chart Definition (This chart also shows how many days the gap was recovered by 50%. It also requires the user to set C#2 to the number of days to lookback for gap. This number will most commonly be 1. If C#2 is set to 2, it will look for a gap from 2 days ago instead of previous day)
Chad Payne of Linn Software and Bill Duryea of IOAMT discuss tools and strategies for statistical analysis in Investor/RT.
Day Session / IB Range Ratio: In this chart we determined that the average ratio between the Day Session Range and the IB Range was 2.15. And on average, the Day Session Range was 10.38 points larger than the IB Range. These averages were computed on the ES over a 1,000 day period ending 5/12/2011.
What is the maximum distance that price moves from the open of the day session each day? What is the average max move? What is the median max move? How often does price open in previous days range? When opening opening in range, how often does it touch both the previous days high and low? How often does it touch neither?
How do I export daily VPOC (Volume Point of Control) to excel along with open, high, low, close and volume for further analysis? How far on average was VPOC from previous day VPOC? How often did price open below/above previous days VPOC? What days had a VPOC very close to previous days VPOC? How often did price open in previous range and touch previous VPOC? How often did price open out of range and touch previous VPOC?
What is the average range and volume of the initial balance, the overnight period, the day session, the 24hr session? How often does price open above/below previous day session range? What is the relationship of overnight direction to day session direction and visa versa?
How frequently does the high of the day or low of the day occur within each 30 minute bar/bracket? within each 5 minute bar?
Chart Definition
Terminology
HOD - High price traded for the day / session.LOD - Low price traded for the day / session.
How frequently does price break above the IB high, below the IB low, to both side, or stay inside the IB for the duration of the session?
Terminology
IB - Initial Balance - Range in which price traded for the first hour of the day session, typically 9:30am ET to 10:30am ET for the ES. IBH = IB high. IBL = IB Low.
Note
IB High Breakout Only = 36.6%, IB Low Breakout Only = 29.7%, Breakout to Both Sides = 31.6%, No Breakout = 2.1% (1,000 days ending 11/23/10)
The videos and pages above answer question such as:
- How often did price extend both above and below the Initial Balance of the past 500 days? How often did it extend just above the high? How often just below the low? (Video 1)
- How often did price open above the previous day session range over the past 100 days? How often did it open below?
- What is the average day session range over the past 1000 days? What is the average IB range? What is the average overnight range?
- Frequency of HOD or LOD occurring within each 30 minute period. Within each 5-min period. (Video 2)
- Relationship of overnight direction (up/down) to following day session direction (up/down) and visa versa.
- If broke down market into 5-minute increments, breakdown of the times that a new high for the day has been made. Purpose would be to see if the chances of new highs being made during lunch period are very slim, while chances of new highs being made towards end of day are much greater. One year sample size.
- Same study as above, but new high would have to be made by 1.00 or more than previous swing high.
- # of lows of day that were formed by a double bottom and triple bottom over the past year (3-minute chart)?
- How many neutral, normal variation, normal days out of a given number of days.
- Average daily range over a number of days.
- Average IB range over a number of days
- How many days open with a gap (Out of range). If so, what was size of gap and then did the gap or ½ gap close
- If open Out of Range, then did it close back with previous day range.
- Number of points previous day VPOC and current day VPOC away from each other. Example, 1170, next day 1177, then seven points away.
- Identify double tops and/or double bottoms on any timeframe, paint/mark them as well and then e able to tell if it held or not.
- If Price opens X number of points away from previous day VPOC, how many points did it close away from previous day VPOC. Example, if open >7 points away, then did it close closer than 7 points or further than 7.
- How often did price open below/above previous days VPOC?
- How often did we have a gap open with a continued drive in direction of gap of say first 2 hours
- How often did we have a gap that got closed same day
- How often did we have a gap within previous days range
- How often is the first hour's range contained with the second hours range- (could be important for ex FDAX, FESX where cash opens 1 hour after initial open, to establish which IB is the most appropriate to use)
- What percentage of todays volume is contained within first 2.5 hours?
How often do we have trend days using following definition : open close to low and close is near the high
- How often do we have days where IB is violated on both sides with a close within IB, with a close on one of the extremes?
- What is the rotational factor of respective product?
- What days opened at or very close to previous days range extreme?
- What days opened in the middle of yesterdays range
- What days opened below/above previous days value area?
- What days had a VPOC very close to previous days VPOC
- Being able to find statistics on Opening Types and how they relate to Day Types would be helpful.
Opening Types
Easily quantitated
Open Auction In Range - Opens Inside Yest Range
Open Auction Out Of Range - Above Yest Range
Open Drive - Drives and doesn't retest open by more than a tick. Also it respects the swings and doesn't cross previous swing hi or lo.
Not easy to quantitate
Open Test Drive - Moves to test a prior area and
Open Rejection Reverse -Moves in the direction it was headed and reverses.
Day Types
Normal - Range is bound by IB
Normal Variation - Breaks out above either IB hi or Lo not both
Neutral - Breaks both IB hi and Lo but settles back inside IB
Neutral Extreme - Breaks both IB hi and Lo but settles at one extreme Non Trend - Holiday (not relevant)
So there's endless cross reference studies that could be done. I'm most interested in finding out about OAIR and OAOR opening types and typically what kind of day they turn out to be. Also, IB size, extension above/below IB, where did it close in relation to open or hi/ lo.
- How often price stop and reverse when it approach or hit: CHVN vs Yesterday HVN, CLVN vs Yesterday LVN, NVPOC, Yesterday (RTH) close vs Settlement
- I am learning excel. First question is how do I build a database. I was going to go thru the charts by hand for many of these data points.
- What is the effect of the o/n range on the days range? average o/n range, above and below average, extreme narrow and extreme wide o/n range.
- What is the effect of the above on the open type itself, tradable probability of open type from the above?
- Probabilities of different opening types based on open, gap up, down, above value, below value.
- Probability of day type following open type.
- Be able to extract volume for an opening swing/range to compare it to other days opening swing/range. If using your own opening swing, then would be some way to be able to pick that area and grab that volume, or be able to pick the time it took for that swing and grab that volume.
- What is most common daily range over past 250 days?
- How often did price extend just above the IB high? [to expand on this, what is the most common distance price extends past the IBH over that period of time]
- How often did price extend just below the IB low? [to expand on this, what is the most common distance price extends past the IBL over that period of time]
- For every day (historically) the ability to list Open price and then what NVPOCs and NCloses are touched and at what time. So the text file would deliver both the price touched and time.
- Another thing that I do is break down Opens and Closes into zones numerically. For Open, if we are above HOD=1, HOD>X>Value Area HI=2, if X is in upper 23% of value area =3, X is in middle 23% of value=4, bottom 23% =5, LOD<X<Value area LO=6, X<LOD=7............ Then I repeat this for the CLOSE based on End of Day Profile. Obviously if I am basing it on EOD profile, I can't have a value of 1 or 7 because I can't finish above or below value.
- On days that the price breaks the IB High/Low, how many ticks did it go past the break before it came back and hit the IB high/low? Is it possible to write a study like with that additional information. This could then be used to look at breaks of any defined level and how far the market went after the break.
-
- When ES gaps > (x) pts, it closed up/down (x) times the following session, and created a higher high or lower low (x) times
- When ES creates an inside day, how frequently does the following day gap up or down? How often is that gap filled?
- How often does an expanded range (outside first standard deviation) lead to an inside day?
- Others are all related to trade specific setups, ie when close is also VPOC, how often does it provide support/resistance? Not sure if raw data from IRT can provide this? Perhaps Fractals?
-
- Number of days out of a set number of days ES opened in previous days range and touched previous days VPOC.
- Number of days our of a set number of days ES opened out of previous days range and touched previous days VPOC.
-
What % of the time is VAH broken if we open above VAH? and if it is broken what % of the time is POC touched? and if it is broken what % of the time is VAL touched?
-
how often gap (1 pt or more) filled when opening in previous day range (1396 days studied)
- - when opening out of range
- - when opening above an up days range (up day defined as close greater than open) - 119/185
- - when opening below an up days range - 28/47
- - when opening above a down days range - 28/38
- - when opening below a down days range - 90/120
Comments
Gaps and NYSE ticks