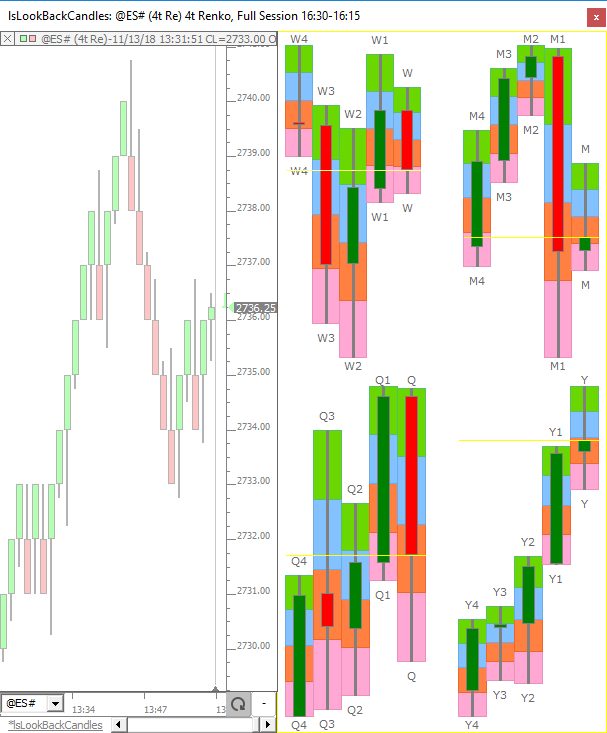
Drawing Tool

FlexMeters (RTX)

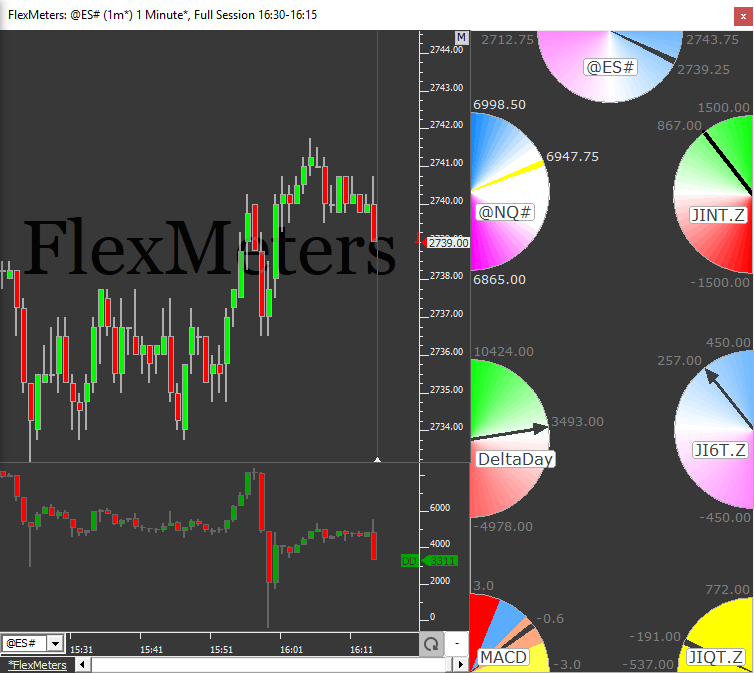
FlexMeters is an RTX extension designed to enable Investor/RT users to display customized meters of market behavior within multi-pane charts. This flexible tool draws meters showing the present value of some price or computed value as compared to a specified range of values seen in the past.  FlexMeters can be drawn using a variety of shapes, colors, positions, titles, and labelling options.  The underlying data values of a FlexMeter can be price values of the associated instrument, or values computed via an RTL custom indicator; thus there is unlimited flexibility in the kinds of market behavior gauges that be made available to the trader at a glance. The range or scale of the meter may be specified manually or it can be computed from minimum/maximum values of a recent period of trading. Even more flexibility can be gained by specifing the range using C# or V# user variables, which may be set by the user or computed by some RTL indicator elsewhere in the trader's workspace.

TrendTool (RTX)

TrendTool is an RTX Extension for easily drawing and editing trendlines on instruments. TrendTool does not replace the long standing Trendline indicator in Investor/RT. Think of it as a companion tool that you may prefer to use sometimes. Some may use it most of the time. TrendTool was developed using the RTX development tools. As a result, TrendTool trend lines can be edited using convenient keyboard shortcuts and mouse actions.

EchoMarkers (RTX)

The RTX EchMarkers Indicator is a Drawing Tool for placing markers that repeat (echo) at the same time and price in prior or future trading sessions

PriceBoxProjections (RTX)

The PriceBoxProjections RTX extension (PBP) is a drawing tool that enables the Investor/RT user to draw an initial price box; the indicator then projects multiple boxes above and below with matching range and offset horizontally by a user-specified distance expressed in bars, pixels, or % of width. The projection boxes are designed to tacitate identification of key reversal opportunities. The box can be setup to snap to the high and low of the bars it contains or the user may adjust the high and low manually by dragging any of the four corners or sides of the box.

LookBackCandles (RTX)

Add the LookBackCandles indicator to your chart to see at a glance how the current trading price relates to various lookback periods of trading: today, this week, this month, last few weeks, etc. Up to 8 lookback periods are shown in one compact display giving the trader both short and long term perspective on price action over various period of the recent past.  LookBackCandles (LBC) can display daily, weekly, monthly, quarterly, and yearly candles; it can depict price action for any lookback period (such as 1 year back, 2 months back).  LBC has an option to utilize its own scale to maximize the vertical space. Or it may share the same scale as the underlying data/instrument plotted in the chart.  Up to 8 periods may be plotted with each instance of LBC and each may be given it's own colors and style or all lookback periods may share the same common colors and style.  Each period may be labeled in order to make it clear what timeframe each bar/candle represents.  A Current Price Line option makes it clear where the current price is in relation to each period, and a Paint Quadrants option allows the background of each of the quadrants of each bar to be drawn in a user-specified color.  All prices computed by LBC may be store into a series of User Variables (V#) that are automatically labeled.  LBC may be aligned to the left or right of the window pane, or dragged into the SideBar by simply dragging onto the scale at the right.

FlexLevels® (RTX)

The FlexLevels® Indicator facilitates the sharing of key price levels for one or more instruments among a group of Investor/RT users. An educator or trading room mentor or an individual trader first creates a chart with the instrument(s) and the desired reference lines he wishes to share.  Using File > Functions > Export FlexLevels, the price levels are exported to a compact text file (a .csv file).  The exported file contains all of the information about each line/level including: price, label, color, width, position details, and band details, if applicable. 

Moving Averages (MA)

Moving averages provide different options for smoothing data. Data is smoothed in order to help reduce the effect of bar-to-bar price fluctuations and help identify longer term emerging trends. A moving average reveals the general direction and strength of a stock's price trend over a given period. The term "Moving" is used to refer to the fact that the window of bars that we are considering remain fixed in width (Period) but moves forward with subsequent bar. Some of the averaging methods however are not so much "Moving" as they are "Cumulative" (exponential for one).

Vertical Reference Line

The Vertical Reference Line is a drawing tool that can be used to draw labelled lines at any data/time in the chart. Click on the "Vertical Line" tool on the chart toolbar. Then position the mouse pointer at any time point in the chart window and click. While the vertical line tool is active, the cursor changes to a pencil. Click as many times as you like to add as many vertical reference lines as you wish. To turn off the vertical line tool, click on the "Vertical Line" tool on the chart toolbar again.

Trend Lines

The Trendline Indicator is a tool for drawing lines from a starting price and time to another price and time in the chart. To draw a trend line, activate trend line drawing by depressing the Trend Line Button chartTrendLine 
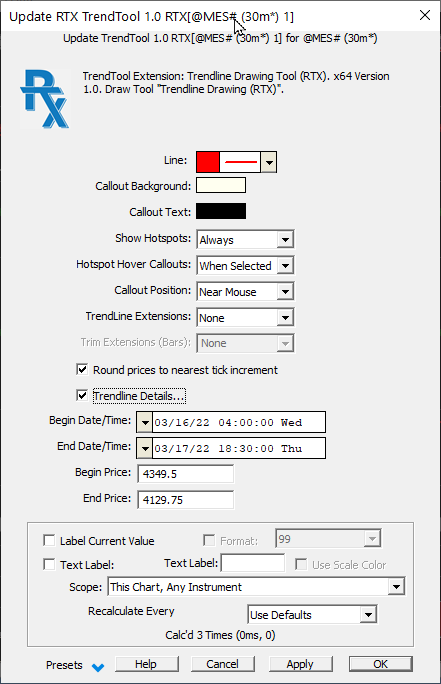
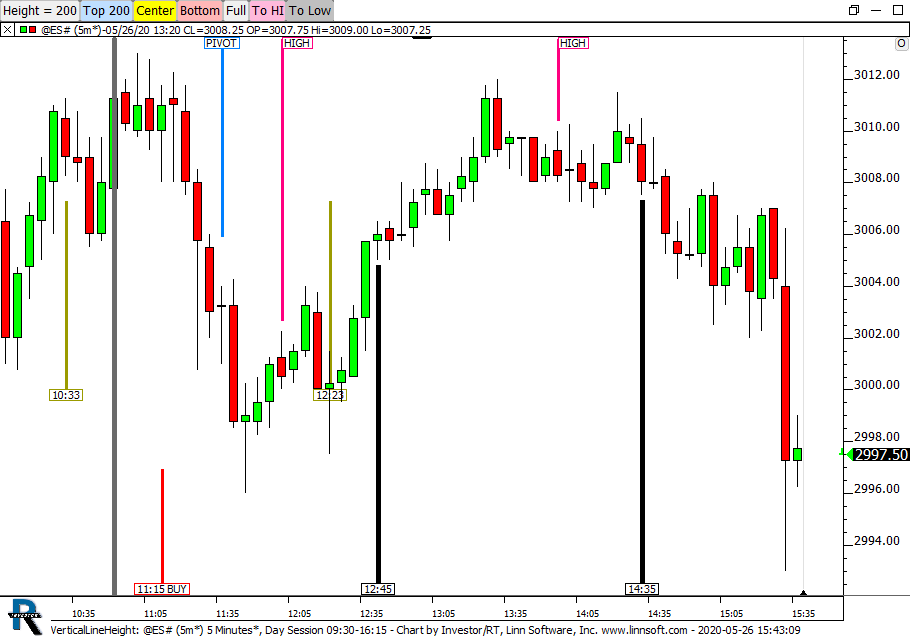
in the chart toolbar. The "button" will remain visually depressed to denote that trend line drawing mode has been selected. The cursor changes to a pencil. Position the mouse and press down to start the trend line.

Pages