Other

BarNumbers (RTX)

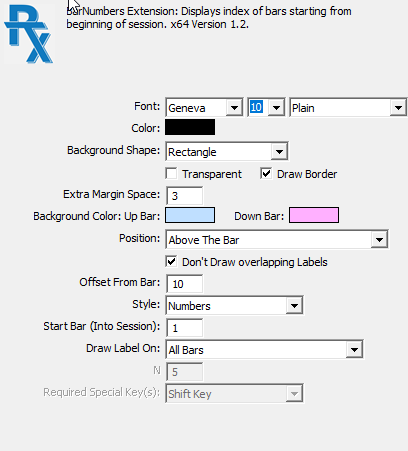
The BarNumbers RTX displays a label for a given bar or set of bars that identifies that bar's sequence from the beginning of its session.  Bars are numbered chronologically from the beginning of each session so that the first bar of any session is bar #1.  This RTX is useful for easily identifying specific bars in a non-time dependent manner, such as for use with trading rooms, collaborations, or mentoring.

Edit User Variable (RTX)

The EditUserVariable RTX Extension is a tool designed to facilitate changing the value of a V#, C#, or T# user variable. Chart buttons, setup with purpose Set V# Variable or Set C# Variable can also be used to accomplish this. If a chart button to set a variable has no specific value, then clicking the button prompts for the value in a dialog box. This works well for occasional changes, but is not convenient for making frequent changes to a user variable.

EchoMarkers (RTX)

The RTX EchMarkers Indicator is a Drawing Tool for placing markers that repeat (echo) at the same time and price in prior or future trading sessions

PriceBoxProjections (RTX)

The PriceBoxProjections RTX extension (PBP) is a drawing tool that enables the Investor/RT user to draw an initial price box; the indicator then projects multiple boxes above and below with matching range and offset horizontally by a user-specified distance expressed in bars, pixels, or % of width. The projection boxes are designed to tacitate identification of key reversal opportunities. The box can be setup to snap to the high and low of the bars it contains or the user may adjust the high and low manually by dragging any of the four corners or sides of the box.

TimeAndSales (RTX)

The RTX TimeAndSales extension (TAS)  is used to embed time and sales displays into any Investor/RT chart window. TAS introduces a variety of new time and sales capabilities such as flexible filtering, highlighting and alerting options and much more.  Display columns are user customizable. These include new data items of interest to traders: Skips, Bid Volume, Ask Volume, Age, Ticks Back and Consolidated Trades.

Clock (RTX)

The RTX Clock indicator provides a display of time in analog and/or digital form with extensive customization options.

Divergence (RTX)

The Divergence RTX indicator quantifies divergence with a numerical value between two data series using various methods. Each data series may consistent of either price data, cumulative delta filtered, filtered cumulative delta, or any other indicator available in Investor/RT.

PaintIndicator (RTX)

The PaintIndicator RTX extension allows users to paint any indicator based on a variety of conditions and draw using some new and unique drawing styles. Up to 6 painting conditions may be specified with each condition giving options to paint based on an indicators value relative to a constant number, an indicators value relative to another indicator, or based on a signal being true. Any custom indicator can be used as the basis for the PaintIndicator. The PaintIndicator has it's own base color which will be used when none of the paint conditions apply.

Calendar Indicator

The Calendar Indicator was designed to allow users to easily identify key events, dates, or date ranges within the bigger picture provided by a calendar. These key dates may include holidays, futures rollover, current day, the visibly charted period, and up to 6 custom periods specified by the user, Week X of Month, Day X of Week, First/Last X Days of Month, Month of Year, and Date.. As with all indicators, the Calendar can easily be toggled via the button indicator by right-clicking on the calendar and choosing Add Button.

SMI Ergodic Indicator

Trading Ergodics with the Trend - Rules

  1. Enter or hold position only when slope of Ergodic Signal line has the same direction as the trend
  2. Stand aside when slope of Ergodic Signal Line is in the opposite direction of trend
  3. Enter or exit position when Ergodic and its Signal Line cross

Pages