Homework (RTX)
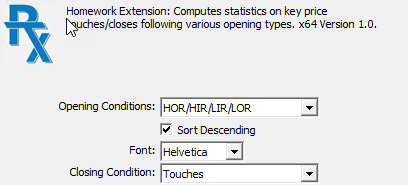
Where does price go based on where price opens?
Where does price go based on where price opens?
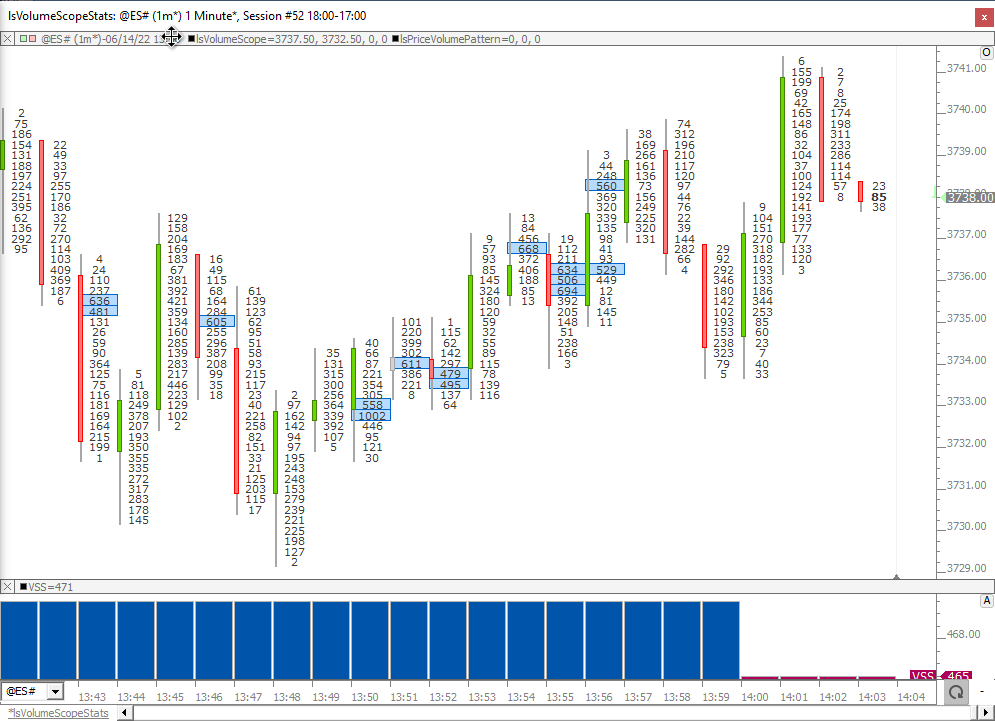
This VolumeScopeStats (VSS) RTX Indicator is designed to compute volume-at-price statistics that are sensitive to both time of day and periodicity of the chart. This allows users to compute and identify values of significant volume or delta at price throughout the day with statistics based on the volume-at-price of the same time of day over previous session.
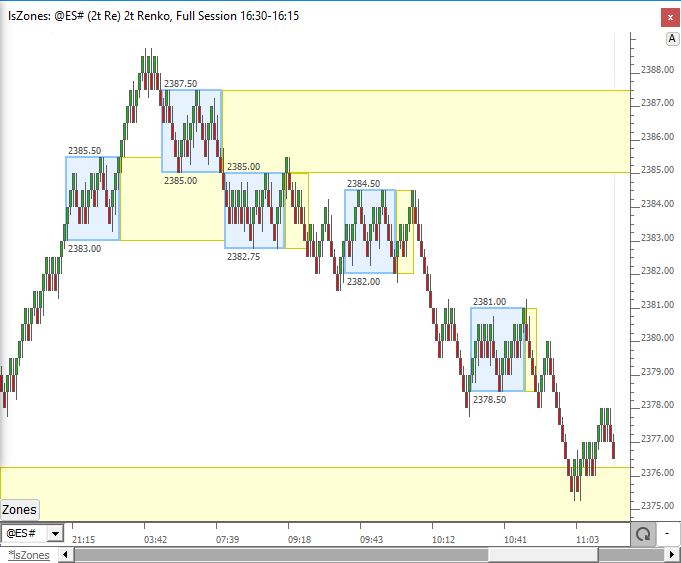
The Zones Indicator is designed to automate the identification of zones between a range of prices over a series of bars/time. The primary motivation for the creation of this indicator is to identfy consolidation zones where price remains in a given range over a minimum period bars or time. An Extend Naked option extends the zones until the zone is filled by future price movement. As an example, Zones can identify when price remained in a 10 tick range over a series of 20 bars or more, and once breaking that range, it can extend the naked band until price moves back across the zone.
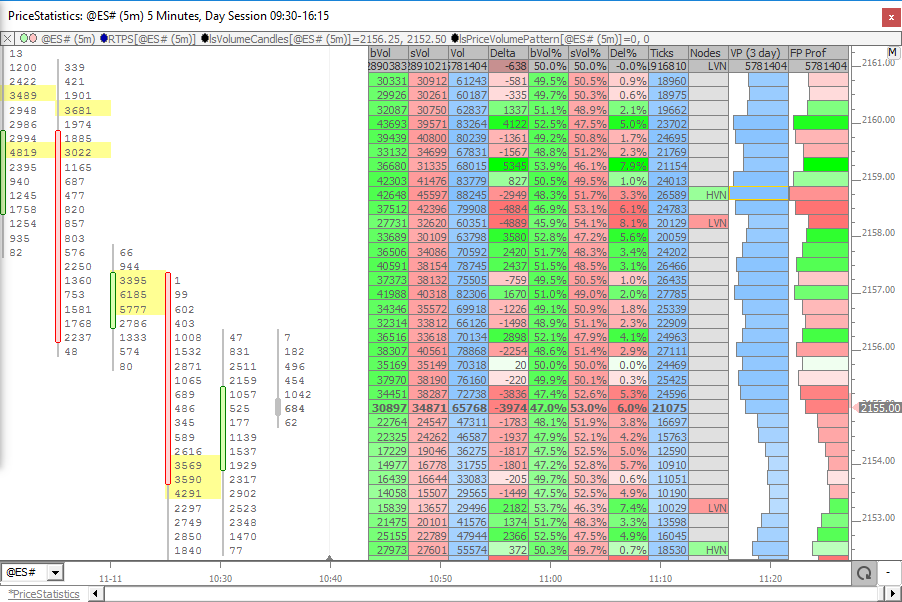
The Price Statistics Indicator presents cumulative volume based information textual for each price over any user-specified period of time (days or bars).
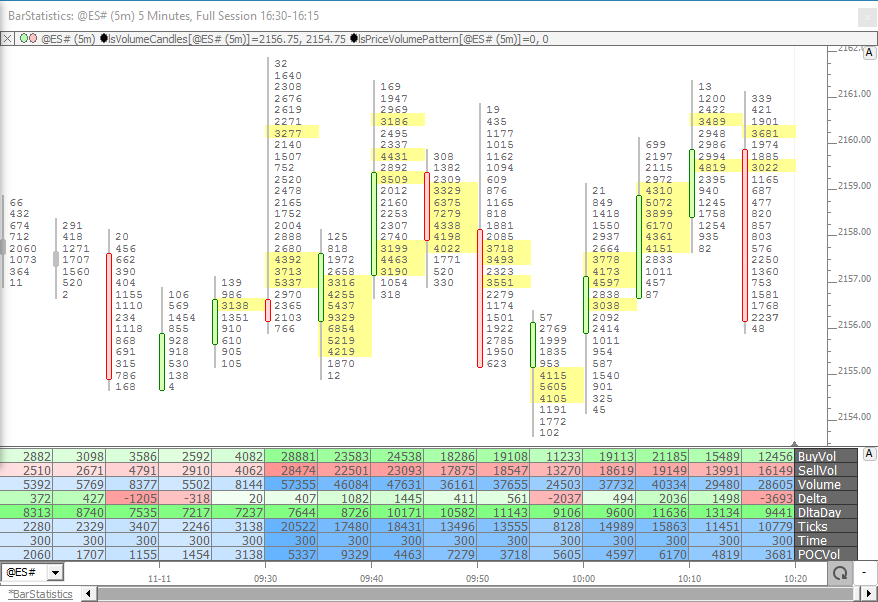
The Bar Statistics Indicator presents cumulative volume based information textual for each bar.
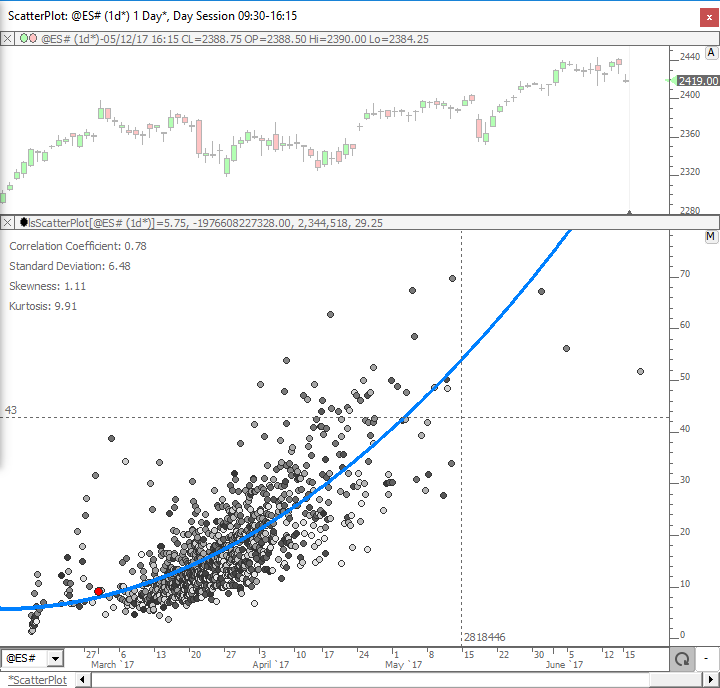
ScatterPlot takes two custom indicators and plots one on the horizontal (X Axis) and one on the vertical (Y Axis) and then computes a best fit polynomial regression line through the data of user-specified degree. Any two custom indicators may be used for the data set of this analysis. Each data point represents the values of the two custom indicators on any given bar. Each bar is drawn as a point/dot in the scatter plot. For example, the indicator can plot the daily volume versus the daily range in price.

In his article "The Quest For Reliable Crossovers" (Stocks and Commodities Magazine, May 2008) author Sylvain Vervoort explains a trading method using the crosses of two moving averages: a zero-lag triple exponential moving average of the typical price HLC/3 and the Heiken-Ashi Close. The Vervoort Oscillator plots the difference between these averages. Vervoort recommended a 55 period average (1 period look back) on daily charts.
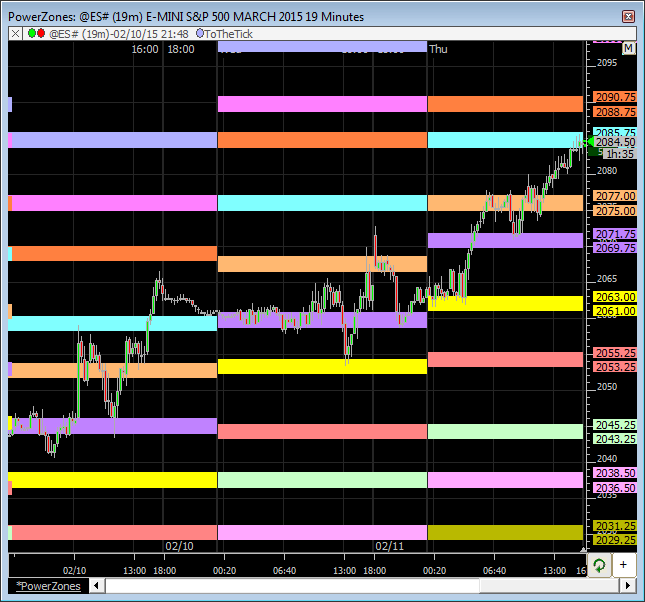
ToTheTick.com Power Zones is the Investor/RT implementation of the daily Power Zones offered by ToTheTick.com. This indicator is implemented via the External Data indicator which is specailly programmed for ToTheTick.com to dynamically grab the zone data from the ToTheTick.com servers. Users must obtain credentials from ToTheTick.com which are entered into the Power Zones preferences in order to activate the indicator.
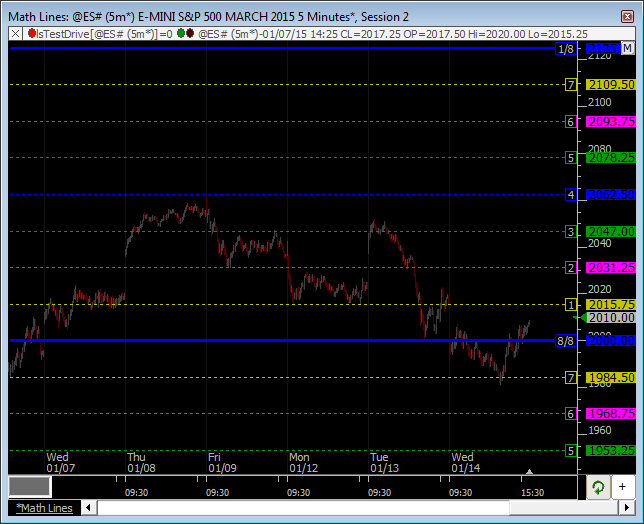
The Investor/RT Math Lines Indicator is the Linn Software implementation of the popular Murrey Math Lines. The Math Lines indicator produces a series of equidistant price-based support and resistance levels. Each level is labeled from 1/8 thru 8/8. The 8/8 (or 0/8) lines are considered the most difficult to break. 1/8 and 7/8 lines are considered weak support and resistance. 2/8 and 6/8 lines are considered strong reverse points. 3/8 and 5/8 are considered areas where it is very likely that the price will either pierce this range fast or will remain inside it for a long time.
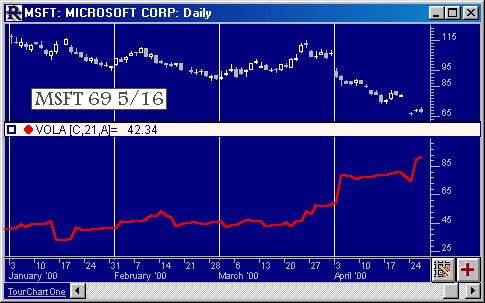
The volatility indicator is based on the same calculation used by Investor/RT in the options analysis feature of the program. The volatility is calculated historically for each bar. Volatility can either be computed based on the periodicity of the chart, or annualized. For example, if your chart is a 1 minute chart with a volatility period of 21 with the "Annualize volatility" checkbox unchecked (not annualized), then the volatility displayed in the indicator would represent a 1 minute volatility based on the past 21 bars in your 1 minute chart.