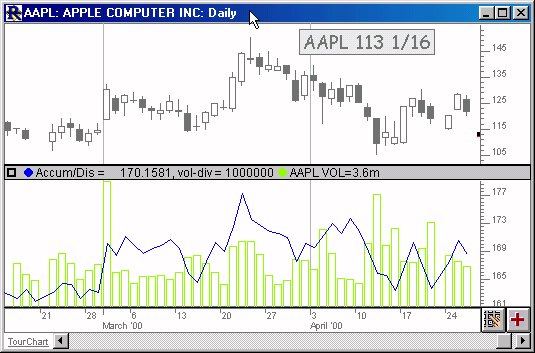
Accumulation/Distribution is a momentum indicator which takes into account changes in price and volume together. The idea is that a change in price coupled...
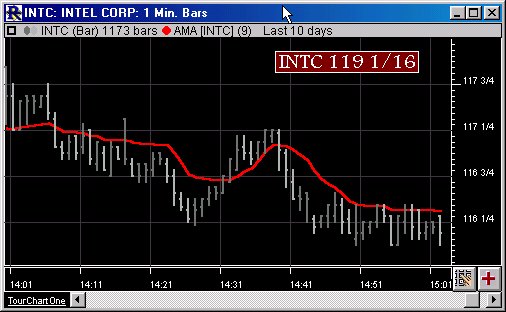
The adaptive moving average moves slowly when prices are moving sideways and moves swiftly when prices move swiftly. The basic rule is to buy when the AMA...
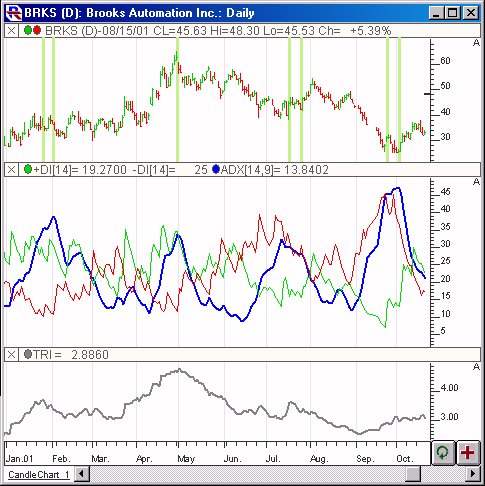
Average Directional Movement is a momentum indicator developed by J. Welles Wilder. The ADX attempts to measure the extent to which a market is trending. This...
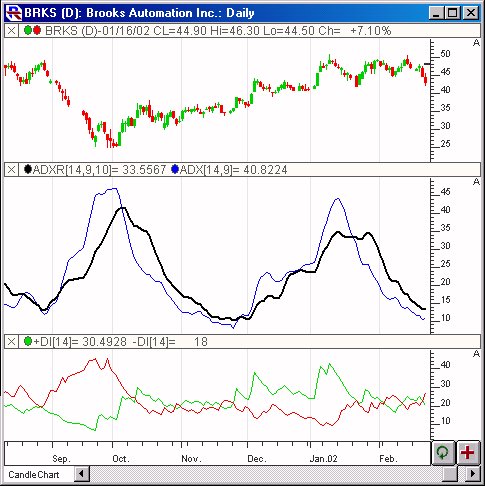
Average Directional Movement Rating quantifies momentum change in the ADX. It is calculated by adding two values of ADX (the current value and a value n...
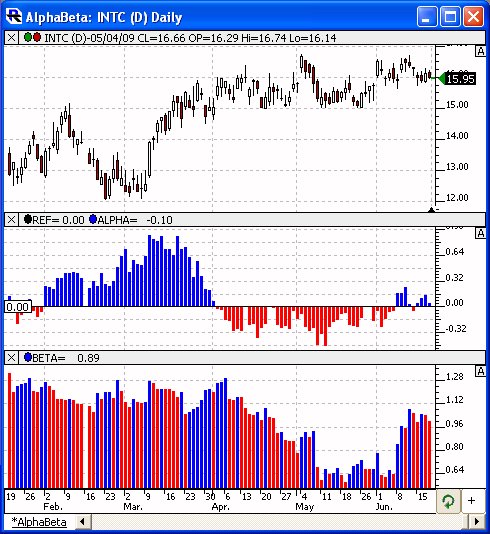
Beta measures the volatility of a security relative to something else, usually a benchmark index like S&P. To calculate beta, you scatter plot the bar to...
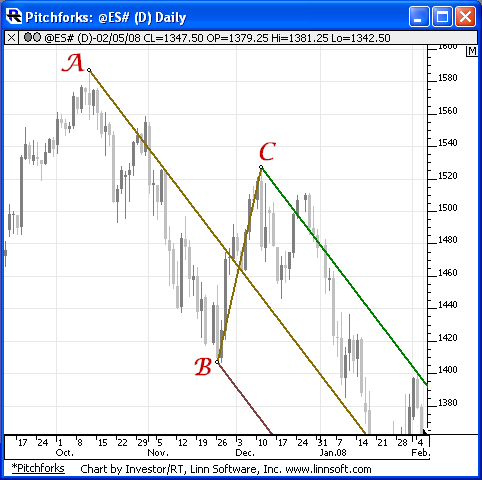
Andrews' Pitchfork is a line study consisting of three parallel trendlines based on three user selected points in time. This tool was developed by Dr. Alan...
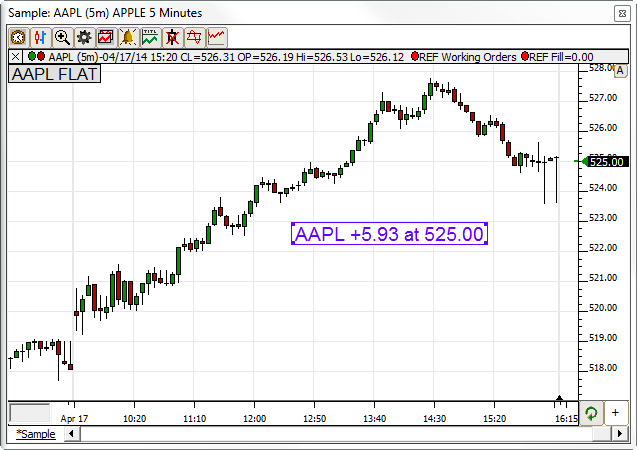
The Annotation tool is used to place text notes or markers on charts. The chart toolbar has a button depicting the letter a for annotation. Click the...
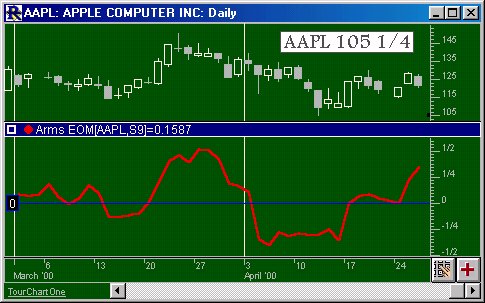
The Arms' Ease of Movement Value (EMV) is a momentum indicator developed by Richard W. Arms, Jr. The indicator takes into account both volume and price changes...
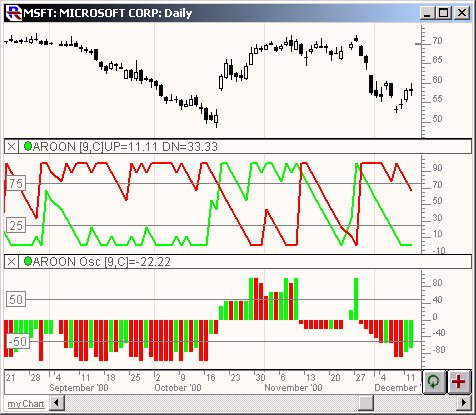
The Aroon indicator was developed by Tushar Chande in 1995. Aroon is used to measure the presence and strength of trends. Aroon can be drawn either as two...
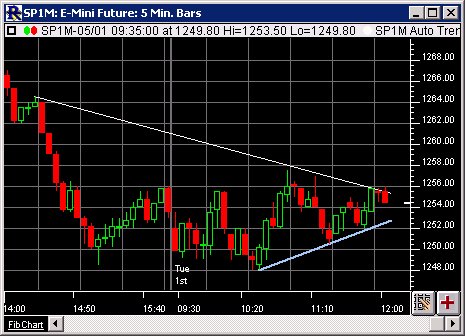
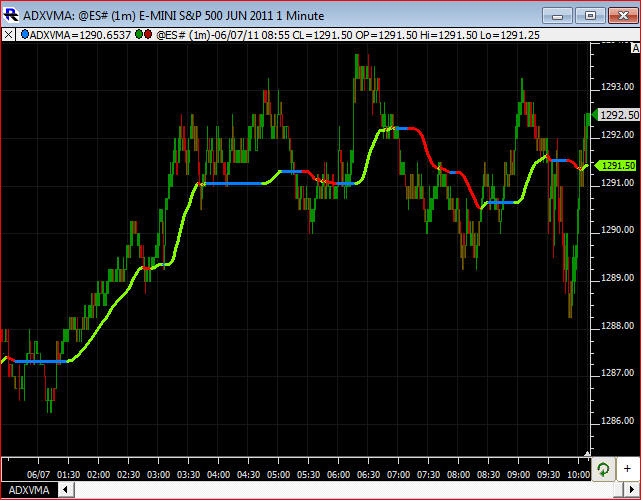
The automatic trend line indicator determines the current up trend and down trend line and draws them. Trend lines may also be drawn manually using the drawing...
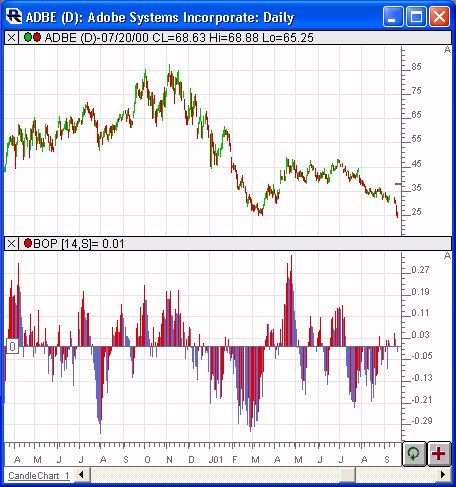
Balance of Power, introduced by Igor Livshin, attempts to measure the strength of buyers vs. sellers by assessing the ability of each to push price to an...