Average Directional Movement is a momentum indicator developed by J. Welles Wilder. The ADX attempts to measure the extent to which a market is trending. This indicator measures the strength of the trend, regardless of direction; the higher the value, the stronger the trend.
The ADX can be used in conjunction with the Direction Indicator (+DI, -DI) to produce an complete trading system. This system consist of three rules: the Crossover Rule, the Extreme Point Rule, and the Turning Point Rule.
The Crossover Rule The Crossover Rule states to establish a long position whenever +DI crosses above -DI, and to establish a short position whenever -DI crosses above +DI. In RTL, the bullish crossover would be accomplished with the following scans: DIPLUS > DIMINUS AND DIPLUS.1 <= DIMINUS.1 while the bearish crossover would be accomplished with the scan DIMINUS > DIPLUS AND DIMINUS.1 <= DIPLUS.1
The Extreme Point Rule Identify a trigger point at the extreme price on the bar the lines cross. If it's a bullish crossing (+DI cross above -DI), you would wait for the price to rise above this extreme price (the high price on the day the lines crossed) on a subsequent bar. If it's a bearish crossing (+DI crosses below -DI), the extreme point is defined as the low price on the bar the lines cross. You would then wait for price to break below this extreme price on a subsequent bar before entering into a short position.
The Turning Point Rule The Turning Point rule first requires the ADX to be above both the DI lines (+DI and -DI). When the ADX turns lower while in this area, the market often reverses the current trend. This is a warning signal that the market is about to change direction. This condition can be discovered with a scan using the following syntax: ADX > DIPLUS AND ADX > DIMINUS AND ADX < ADX.1 AND ADX.1 >= ADX.2
According to the developer of this system, you should stop using any trend following system when the ADX is below both DI lines, as no discernible trend exists.
Presentation

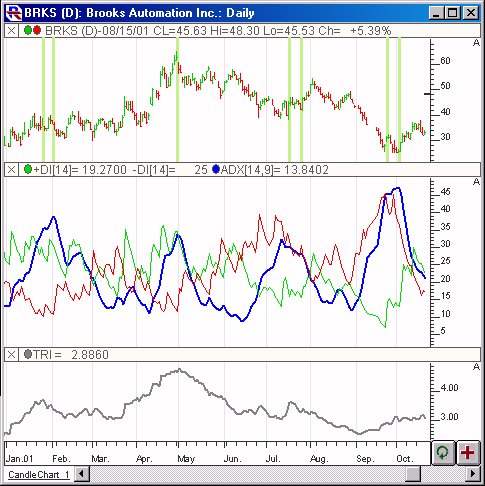
Above is a Daily Chart of Brooks Automation (BRKS). The middle pane contains the ADX line (in blue) and the +DI (green) and -DI (red) lines. The lower panes shows the Average True Range indicator in gray. The upper pane has a Color Marker overlaying the price bars, showing where the ADX line turned down while above both the +DI and -DI lines. The Preferences
Formula
Keyboard Adjustment
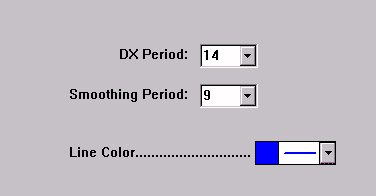
The DX Period and the Smoothing Period both can be adjusted directly from they keyboard without opening up the preference window. First, select the indicator, then use the up and down arrow keys to adjust the DX Period up or down by 1. To adjust the Smoothing Period, hold down the shift-key while hitting the up and down arrows on your keyboard.


