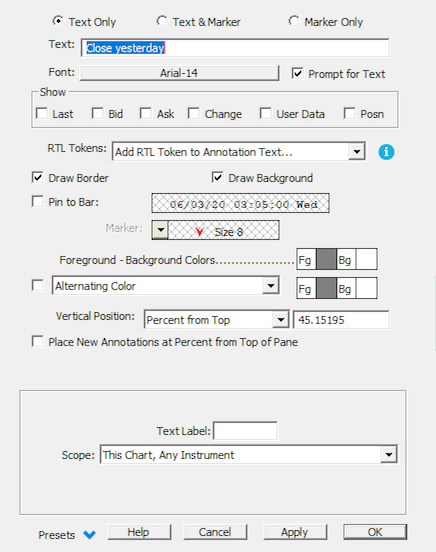
The Annotation tool is used to place text notes or markers on charts. The chart toolbar has a button depicting the letter a for annotation. Click the annotation tool button and the cursor changes to a pencil. Move the mouse to the spot in the chart where you wish to place a textual annotation. Click the mouse and a text entry box will appear. Type in the text and press return. The new Text tool creates an "Annotation" indicator. The annotation indicator has been a part of Investor/RT for a long time but adding annotations has never been this easy. Like the trend line drawing tool, the text tool is "turned off" when you complete the mouse click. Hold down the shift key when you click to add an annotation if you want the tool to remain selected for placing another annotation box. Once you have placed an annotation in the chart window, if you want to revise the text then right + click (Mac users command + click) on the text. A dialog will appear showing the settings for the Annotation. Revise the text and/or any of the settings in the dialog. Note that the annotation indicator has been improved to allow the user to choose a marker to appear along with the textual commentary. There are two types of chart annotations-those that are associated with a specific date/time and those that are time-independent. In the annotation settings there is a check box titled "Attach to bar". When this box is unchecked, the text is fixed in the window. You can drag and drop the annotation to another location, but the text does not move as you change periodicities or scroll the horizontal viewing period scroll bar. If you drag and drop an annotation that is attached to a bar, the annotation will become associated with the bars date/time where you dropped it in the chart window. After completing a drag and drop of an annotation a message in the main toolbar message area will tell you the new date/time of the textual annotation. Use Setup: Preferences: Charting: Technical Indicators: Annotation to adjust the default settings for adding new annotations via the text tool. If you want your annotations to be fixed within the window rather than pinned to a particular date/time, be sure to mark the check box cited above. To adjust an existing annotation in a chart, simply right-click on it to access its properties. Then check the box titled Last, Bid, Ask, or Change if you wish these quoted prices to be appended to the text (you can leave the text blank if you like). The quoted prices are updated as trades occur. If the "Text is not date/time specific" check box is unchecked, the annotation will be pegged to the date specified, that is, the note will move as the horizontal scroll bar is used to scroll the chart. If this box is check, the note behaves like a "sticky" note, that is, it does not move as the time axis changes. Change the font and text color if desired using the color box and the font box. Select a time to which your note pertains.
To enable more powerful diagnostic messaging during backtesting, the Annotation indicator (from IRT's charting system) has been added to the RTL language. The token is NOTE. The NOTE token is simply a way to output instrument specific values to the backtesting detail report. Typically, the NOTE token ( considered a "logical" token not an arithmetic one) could be added to an existing rule's signal, e.g. NOTE and MACD.1 < 0 and MACD > 0 Or, the NOTE can be isolated into a NONE or TEST rule as simply: NOTE = TRUE The NOTE token always evaluated as TRUE. The NOTE token, like any other technical token can be qualified, e.g. a TEST rule may look like: NOTE.1 and NOTE.2 and NOTE.0 The NOTE can be setup as a string of text plus instrument specific RTL tokens preceded by the % percent sign. For example, the NOTE text of: %TICKER at %CL, HI=%HI LO=%LO displays messages like the following in the backtesting detail report: IBM at 104.50, HI=105.75 LO=104.00 When you qualify a NOTE, e.g. NOTE.1, the values displayed will be for the preceding bar. This applies to historical tokens like %OP, %HI, %LO, %CL, %VO, %OI. It does not apply to V# variables. A NOTE text that contains "%V#1" for example will display the current value of V#1 for the instrument regardless of the qualifier. Using the NOTE tokens inside signals that are used to form TEST or NONE action rules provides the user with a powerful diagnostic capability to see step-by-step for each bar why the trading system is performing the way it is.
Presentation

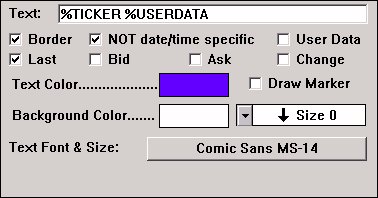
Above is a 5 Minute Candlestick Chart of Apple (AAPL). The Annotation is seen with a white background and blue text as seen in the preferences below. This annotation shows the last price and the change. At the upper left is a special annotation, added to the chart automatically by Investor/RT when trading is occurring for symbol(s) in charts. This is a Position annotation, stating the trading position at the present time.
Keyboard Adjustment
Click inside an annotation and drag and drop the annotation to a new location in the chart. With an annotation selected, use the up/down/left/right arrow keys to move the annotation in any direction.