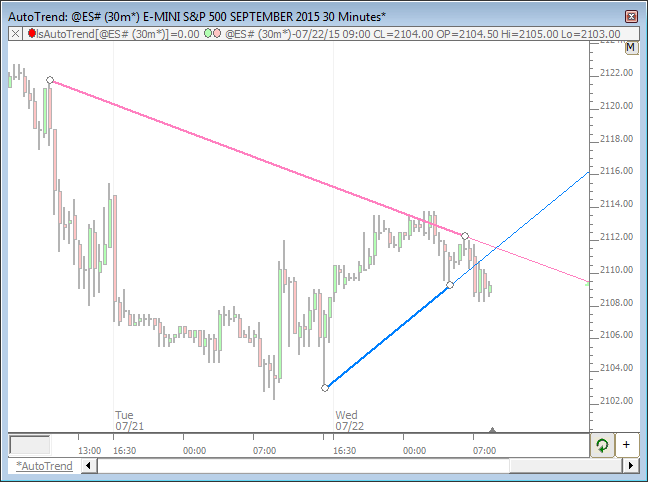
The automatic trend line indicator determines the current up trend and down trend line and draws them. Trend lines may also be drawn manually using the drawing tool on the charting toolbar, but this indicator does it automatically. The user specifies the number of periods to "look back" from the present to determine where to place the trend lines. The up trend line connect the lowest low in the user specified period with the next lowest low preceding the highest high for which the trend line is not penetrated.
The down trend line connects the highest high in the period with the next highest high preceding the lowest low for which the down trend line is not penetrated. The user may specify the colors and whether to draw either the up, the down trend, or both. In some cases, depending on the historical pricing of a particular issue, there may not be a valid up or down trend for the user specified period. This indicator can be applied multiple times to the same chart window. For example, in a daily chart, you could add auto trend lines for periods of 500, 250, and 60, to see long term, intermediate term and short term trends in your charts. Auto trend lines are especially useful in slide shows. As the slide show advances from one issue to the next, the current trend lines for the issues are calculated and drawn automatically. This is not possible with manually drawn trend lines.
Presentation

Above is a 5 Minute Candlestick Chart of the S&P 500 Future Contract (SP1M). The uptrend line can be seen in green, with the downtrend line in red. The trendline is based on a period of 100 as seen in the preferences below. Refer the the description at the bottom of this page for further details on how the trendlines are determined.