Center Of Gravity (COG)

COG is an oscillator based on an article by John F. Ehlers on page 20 of the May 2002 issue of Stocks and Commodities Magazine. COG has essentially zero lag and enables clear identification of turning points. This indicator is a result of Ehlers research into adaptive filters. The Investor/RT implementation of COG includes an option to "Volume Weight" the oscillator. When this option is checked, volume will be used in addition to price to weight the indicator.

Presentation
cog

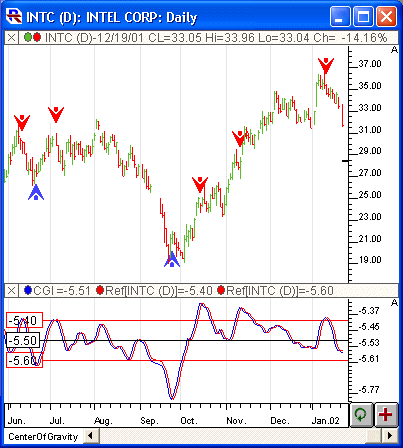
Above is a Daily Candlestick Chart of the Intel Corporation (INTC). The blue line in the lower window pane represents the Center of Gravity Oscillator drawn using the preferences displayed below. The red line is the signal line. The bars are overlaid with scan markers showing the turning points of the Center of Gravity.

Formula

Keyboard Adjustment

The Center Of Gravity period can be adjusted directly from the keyboard without having to open up the preferences window. Just select the indicator and then hit the up or down keys on your keyboard. The up arrow key increases the period by 1 while the down arrow key decreases the period by 1.

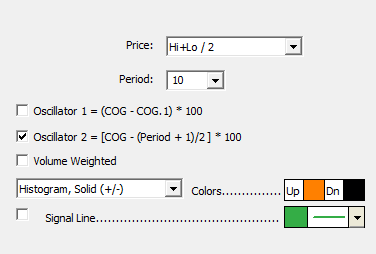
cogprefs

  • Price - Price value used as input for the computation. Options include Open, Close, High, Low, HI+LO/2, HI+LO+CL/3, O+H+L+C/4, %Change, or OP+CL/2.

  • Price - Period over which the Center of Gravity is computed.

  • CGI Line - Color and style of the Center of Gravity line.

  • Signal Line - Color and style of the signal line. If the checkbox is unchecked, the line will not be drawn.

  • Volume Weighted - If this checkbox is checked, volume will be used, in addition to price, to weight the number series in the Center of Gravity calculations.

  • Oscillator 1 - This oscillator represents the difference between the COG and the Signal line (or COG.1) multiplied by 100. When the oscillator crosses the zero line in the upward direction, it represents the COG turning upward, and should therefore be considered a bullish signal. When the oscillator crosses the zero line in the downward direction, it represents the COG turning downward, and should therefore be considered a bearish signal. The reason the oscillator value is multiplied by 100 is for scaling purposes. The oscillator is really nothing more than the change in the COG multiplied by 100.

  • Oscillator 2 - This oscillator shifts the COG values so that they oscillate about the 0 line. Otherwise, COG oscillates about a reference line at (Period + 1)/2. This oscillator value is also multiplied by 100 to give more reasonable (scalable) results. This option makes it easier to compare COG indicators of differing periods.

No examples. Let us know if you'd like to see one added.
No videos. Let us know if you'd like to see one added.