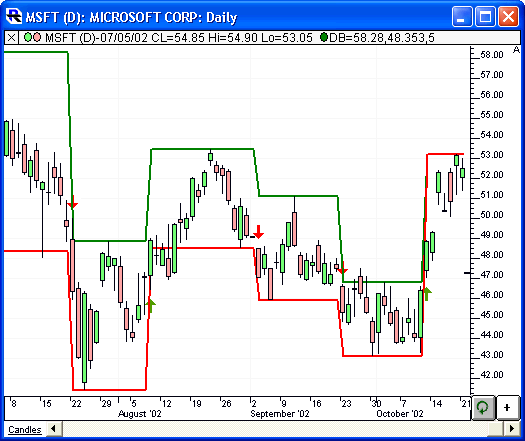
The Darvas Box is considered by some to be a trading system wrapped up into a single indicator. The indicator uses a series of five states to draw the upper and lower lines of a box by finding highs and lows.
Presentation

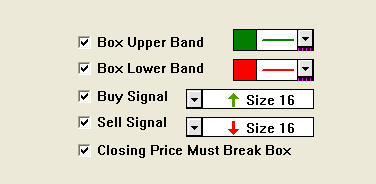
Above is a Daily Candlestick Chart of an Microsoft Corporation (MSFT). The Darvas Box indicator is drawn with a green upper band and a red lower band overlaying the MSFT candles. Buy signals are drawn in green arrows beneath the candles, while sell signals are drawn with red arrows above the candles.
The description below explains the method used to construct boxes that immediately follow buy signals. A similar method is used to construct boxes that are following sell signals, except the lows are considered first, then highs (basically, just interchange the highs and the lows). We'll call the method explained below the HighFirst method (as opposed to LowFirst method). The HighFirst method is used after buy signals, while the LowFirst method is used after sell signals. So which method is used to begin with (starting on very first bars)? Which ever method results in a Darvas box being formed first is the method that is chosen.
The HighFirst Method At least three bars are spent finding and validating the top of a box (States 1, 2 and 3), and at least three bars are spent finding and validating the bottom of a box (States 3, 4 and 5). Once State 5 is reached, the Darvas Box is now complete with a valid box top and a valid box bottom, and we simply wait until we get an input price greater than the top of the box or less than the bottom of the box.
First, obtain the high and low price of the stock for the first bar. On bar one, you start off in "State 1". This state tells you to set the BoxTop to this bar's high. Now what? Nothing, you are done for the bar. Only one state per bar. From State 1, we determine if the BoxTop that was saved from State 1 is greater than this bar's high. If the BoxTop that was saved from the previous bar is bigger than this bar's high price, go to State 2 and keep the BoxTop from the previous bar. If the BoxTop that was saved from the previous bar is smaller than this bar's high, go back to State 1, and set the BoxTop to this bar's high (a new BoxTop). From State 2, we determine if the BoxTop that was saved from State 1 is greater than this bar's high. If the BoxTop that was saved from two bars ago is greater than this bar's high price, go to State 3 and keep the BoxTop from two bars ago, plus we now set the BoxBottom to this bar's low. If the Box Top that was saved from two bars ago is smaller than this bar's high, go back to State 1, and set the BoxTop to this bar's high (a new BoxTop). From State 3, we look to see if the BoxTop that was saved from bars past is greater than this bar's high. If this bar's high is greater than the BoxTop, we must go all the way back to State 1. On the other hand, if the BoxTop that you saved from bars past is still greater than this bar's high, you get to move to the second decision box. Now, we look to see if the BoxBottom that was saved from the previous bar is lower than this bar's low. If it is, we can move to State 4 and keep the previous bar's BoxBottom. On the other hand, if this bar's low is lower than the saved BoxBottom, go back to State 3, and set the BoxBottom to this bar's low. State 4 is similar to State 3. First, determine if the BoxTop that was saved from bars past is greater than this bar's high. If this bar's high is greater than the BoxTop, we go back to State 1. On the other hand, if the BoxTop that was saved from bars past is still greater than this bar's high, we move to the second decision box. Now, we determine if the BoxBottom that you saved from two bars ago is still lower than this bar's low. If the BoxBottom that was saved is higher than this bar's low, we go back to State 3. Once in State 3, we again set the BoxBottom to this bar's low selling price. If we have a BoxBottom lower than this bar's low, we move to State 5. In State 5, we now have a valid BoxTop and a valid BoxBottom. Once in State 5, we have created a Darvas Box. Simply wait until you get a bar's high selling price that is greater than your BoxTop (a buy signal) or a bar's low selling price that is lower than your BoxBottom (a sell signal).


