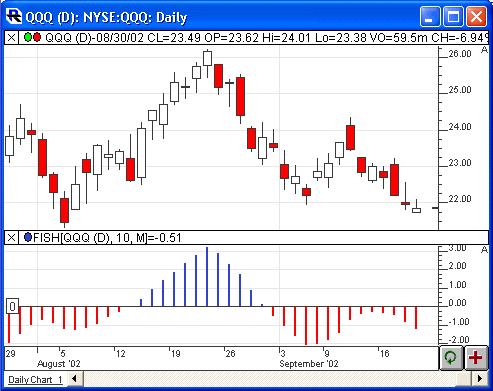
Fisher Transform (FISH) is based on the article "Using The Fisher Transform" by John Ehlers that will be available in the November 2002 issue of Stocks and Commodities Magazine. FISH has sharp and distinct turning points that occur in a timely fashion. It is based on the assumption that prices do not have a Gaussian probability density function (PDF), but you can create a nearly Gaussian PDF for prices by normalizing price, or an indicator such as RSI, and applying the Fisher Transform. The resulting peak swings clearly identify price reversals.
Presentation

Formula
Keyboard Adjustment
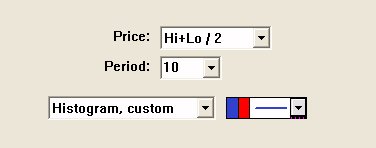
The Fisher Transform period can be adjusted directly from the keyboard without having to open up the preferences window. Just select the indicator and then hit the up or down keys on your keyboard to adjust the period. The up arrow key increases the period by 1 while the down arrow key decreases the periods by 1.


