Fractals - Swing Highs, Swing Lows
The Investor/RT Fractal indicator is based upon the "Bill Williams Fractal" in the book "Trading Chaos" by Bill Williams, PhD. A fractal is an entry technique that is traditionally defined as "a bar that has two preceding and two following bars with lower highs (or lower lows, on a down move)". Several different varieties of up and down bar 5-bar fractal formations can be seen below.

Presentation
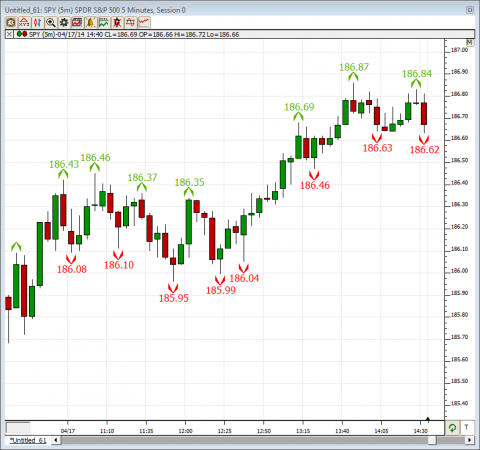
Above is a Daily Candlestick Chart of Intel Corporation (INTC). The Fractal indicator is drawn overlaying the INTC candles, using the preferences seen below.
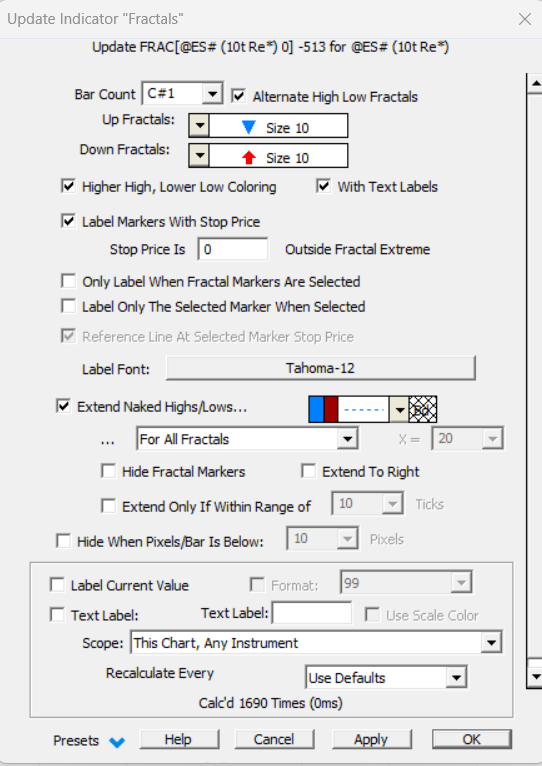
- Bars Involved -The number of bars required in order for a fractal to be considered complete. Traditionally, fractals involve 5 bars. A 5-bar up fractal defines a pattern where one bars is preceded 2 bars with lower highs and followed by 2 bars with lower highs (deviations exist and are discussed below). Others options include 3, 7, 9, 11, 13, 15, 17, or 19 bars.
- Up Fractal -Marker size, style, and position for up fractals. Up fractals occur when a bars high exceeds the high of a given number of preceding and following bars.
- Down Fractal -Marker size, style, and position for down fractals. Down fractals occur when a bars low is lower than the low of a given number of preceding and following bars.
- Label Markers With Stop Price -If this box is checked, the markers will be labeled with the "Stop Price". The Stop Price value is dictated by the following preference.
- Stop Price is ___ Outside Fractal Extreme -The "Fractal Extreme" is the high price of an up fractal, or the low price of a down fractal. If a value of 0.25 outside fractal extreme is specified, and an up fractal occurs with a high of 875.50, then the marker will be labeled with a stop price of 875.75. Similarly, if a down fractal occurred with a low price of 860.25, then the down fractal marker would be labeled with a stop price of 860.00. On up fractals, the stop price is generally placed one "tick" above the high price, and the stop is considered a "Buy Stop" in which a long position should be entered when price returns to that stop price. On down fractals, the stop price is generally placed one "tick" below the low price, and the stop is considered a "Sell Stop" in which a short position should be entered when price returns to that stop price.
- Only Label When Fractal Markers Are Selected -If this checkbox is checked, the marker labels will only appear when the indicator/markers are selected. This can reduce clutter in the chart, and draw labels only when needed.
- Label Only The Selected Marker When Selected -If this checkbox is checked, then only the marker that was selected will be labeled. If this checkbox is unchecked, all labels will be shown when markers are selected (provided that option is turned on as well).
- Reference Line At Selected Marker Stop Price -If this option is checked, a reference line will be drawn at the markers stop price when that marker is selected.
- Label Font -This controls the font, size, and style of the marker label.
 |
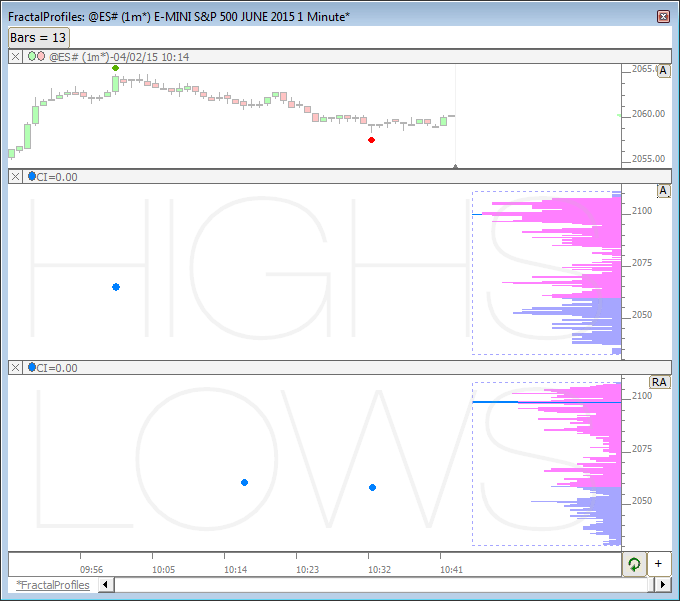
This chart is documented in the Profiles On Indicators article. The FractalProfiles chart extracts significant highs and lows and profiles those highs and lows. The significant highs are extracted... Read more Download
|
|
Pop-up Video |
Description |
View |
 |
This video demonstrates how to add the extend a line from the naked high and low prices of the... |
Watch |