MACD is an acronym for Moving Average Convergence Divergence. Developed by Gerald Appel, MACD utilizes various exponential moving averages of closing price to generate buy and sell signals. Exponential moving averages assign greater weight to the most recent price data and therefore are more sensitive to current price movement than simple moving averages. MACD consists of a Differential Line and a Signal Line. The Differential Line is constructed by measuring the difference between two exponential moving averages, typically a 12- and 26-period. The Signal Line is a 9-period exponential moving average of the Differential Line values. Buy signals are generated when the Differential Line crosses the Signal Line from below while sell signals occur when the Differential Line crosses the Signal Line from above. Investor/RT also displays the MACD Oscillator, which is a graph of a single line which crosses a zero reference line when these signals occur. A cross of zero from below into positive territory represents a buy signal, and a cross of zero from above into negative territory indicates a sell signal.
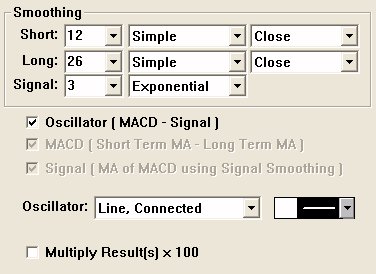
The MACD preferences provides more flexibility over both calculation and display. Three independent moving average types are specifiable: one for the short term moving average, the long term moving average, and the signal moving average. In the past, all three moving averages were calculated using the same moving average type. Also, the short and long term moving average now have independent "price" choices. In the past, both shared the same price type. This added flexibility provides for calculations such as the difference between the short term exponential average of the high and the long term weighted moving average of the low. To use the "classic" MACD indicator, specify the same moving average type and price. In addition, the Signal and MACD drawing options, presented when the "oscillator" option is unchecked, have their own independent drawing styles. One may choose to draw the MACD as a solid histogram, with the Signal as a continuous line overlaying the histogram. The drawing of the Signal or MACD lines/histograms is also optional. In the past, when "oscillator" was unchecked, both the Signal and the MACD lines would be drawn unconditionally. Either or both may be drawn, depending on which are checked.
Presentation

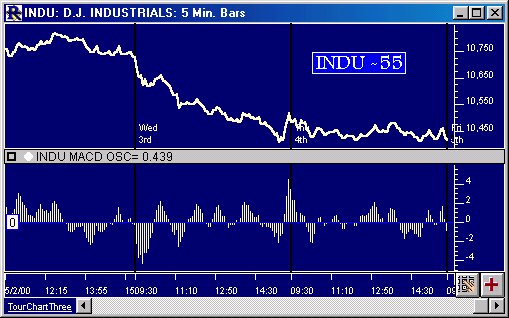
Above is a 5 Minute Line Chart of the Dow Jones Industrial Average(INDU). The lower window pane contains the MACD oscillator, oscillating around a zero reference line.
Formula
Keyboard Adjustment
The Short Term Period can be adjusted directly from the keyboard using the up and down arrows. To adjust the Long Term Period, hold down the shift key while hitting the up or down arrow keys. To adjust the signal period, hold down the ctrl key while hitting the up or down arrow keys


