The momentum indicator is a measure of price change velocity. It is a simple calculation. For each bar the momentum is calculated as the difference in price between that bar and the bar a fixed number of periods ago. Normally the closing price is used but Investor/RT allows you to calculate the indicator using other price values (e.g. high, low, median price, etc.). Investor/RT also provides an optional smoothing moving average of the raw momentum calculation. Either or both lines, raw and smoothed may be drawn on the chart. The momentum line(s) oscillate around the zero line. A change in slope of the momentum line can be an indicator of market tops and bottoms. Generally, a buy is signaled when the momentum line crosses above zero and a sell is indicated when the line falls below the zero line. The indicator is essentially identical to the "Rate of Change" indicator which measures the ratio instead of the difference in prices.
Presentation

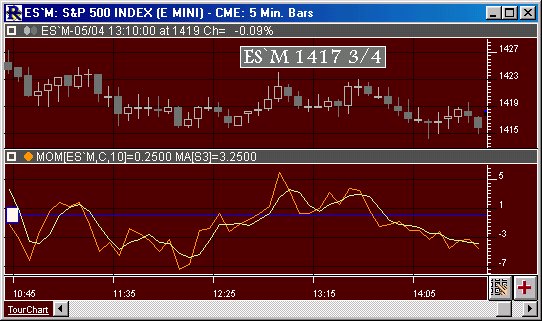
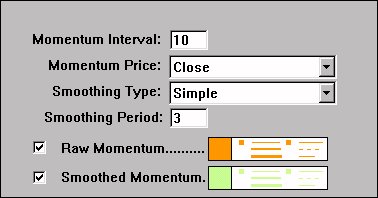
Above is a 5 Minute Candlestick Chart of an S&P E-Mini Futures Contract (ES`M). The lower window pane contains the Momentum Indicator, oscillating around a zero reference line. The orange line represents the raw momentum, with the lime green line representing the smoothed momentum. The Preferences . . .


