The Percent Change Indicator calculates and draws a line showing the n-period percent change in either volume or price for an instrument. The indicator oscillates around zero with positive values indicating increasing prices (or volume) and negative values indicating declining prices (or volume). If you wish to see both percent change to volume and percent change in price in the same chart, apply the indicator multiple times , once with "Price" check marked, and again with "Volume" check marked. You can add both to the same chart window pane if you like. This indicator graphs the percent change in price or volume (or both) over a specified time period. It can be very useful in gauging whether volume has confirmed a price move by increasing with the move. By the same reasoning, decreasing volume while price moves in a given direction may represent the countertrend.
Presentation

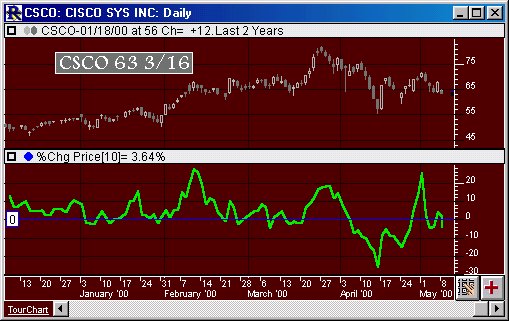
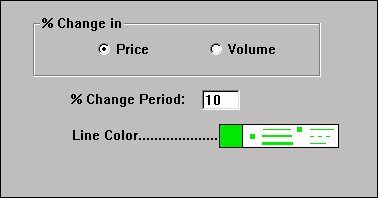
Above is a Daily Candlestick Chart of Cisco Systems (CSCO). The bold green line in the lower pane represents the 10 Period Price Percent Change, as specified in the preference window below. A horizontal reference line is automatically draw at zero.


