The Relative Strength Index (RSI) is a popular price momentum oscillator developed by J. Welles Wilder and introduced in his 1978 book New Concepts in Technical Trading Systems. The RSI oscillates in a range between 0 and 100 representing a comparison of the magnitude of a stock's recent gains to the magnitude of its recent losses.
In mathematical terms, RSI = 100 - 100/(1+RS) where RS is calculated as the ratio of two exponentially smoothed moving averages, AG/AL. AG is the average price gain over some period and AL is the average price drop over some the same period.
The name "Relative Strength Index" may be somewhat misleading, as it does not compare the relative strength of two securities such as the Relative Strength (RS) indicator does, but rather the internal strength of a single security.
A popular method of analyzing the RSI is to look for a divergence. If the instrument is making a new high, but the RSI is failing to exceed its previous high, this "divergence" is an indication of an coming reversal. When the RSI then turns down and falls below its most recent trough, it is said to have completed a "failure swing" and therefore confirmed the coming reversal.
Overbought / Oversold The RSI indicator ranges in value from 0 to 100, with numbers above 70 indicating overbought conditions and under 30 indicating oversold. If the RSI rises above 30, it is considered bullish, while if the RSI falls below 70, it is considered bearish. These situations can be represented in the following two scans:
Bullish (Oversold) RSI > 30 AND RSI.1 <= 30
Bearish (Overbought) RSI < 70 AND RSI.1 >= 70
Divergence Another popular method of analyzing the RSI is to look for a divergence. If the instrument is making a new high, but the RSI is failing to exceed its previous high, this " divergence" is an indication of an coming reversal. When the RSI then turns down and falls below its most recent trough, it is said to have completed a "failure swing" and therefore confirmed the coming reversal.
Crossing the Center Line (50) Some trades view a move above 50 as a bullish confirmation, and a move below 50 as a bearish confirmation. A move above 50 represents average gains overtaking average losses, while a move below 50 signifies that average losses have taken the lead. These situations can be represented with the following scans:
Bullish Center Line Cross RSI > 50 AND RSI.1 <= 50
Bearish Center Line Cross RSI < 50 AND RSI.1 >= 50
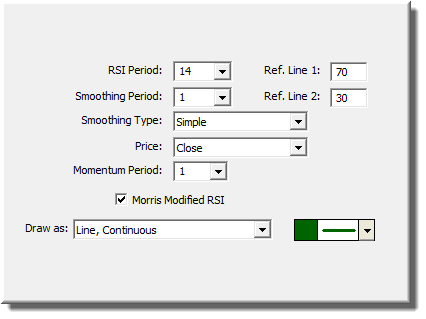
If a momentum period greater than 1 is specified, this period becomes the look back period for comparing closes to determine gains and loses. For example, if the momentum period is 9, then the current close is compared to the close 9 periods ago. If the current close is higher, the close 9 periods ago is subtracted from the current close to be used in computing the average price gain (AG). The RSI period specifies how many bars will be used in computing the average. The resulting RSI can then be smoothed. An RSI using a momentum period greater than 1 is sometimes referred to as the RMI (Relative Momentum Index). A momentum period of 1 would result in a classic RSI. Morris Modified The RSI technical indicator has been enhanced to provide the option of calculating the RSI according to the Morris Modified RSI algorithm as described in the 1998 bonus issue of Stocks and Commodities Magazine (p. 56). The Morris calculation differs slightly from the classic Welles Wilder calculation and typically generates more buy/sell signals as the RSI crosses the 70 and 30 threshold values. The Morris calculation uses only the most recent trading days instead of averaging in past data. In the RSI equation, the Average Gain (AG) and Average Loss (AL) variables are computed using only the last X periods, where X is the RSI Period specified. Otherwise, in a non-Morris Modified RSI, these averages are cumulative.
Presentation
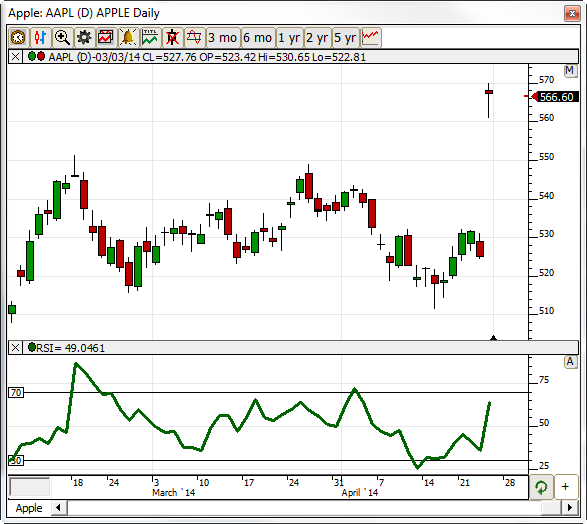
Above is a Daily Candlestick Chart of the Apple Computers (APPL), The Relative Strength Index can be seen in the lower pane, drawn in green. The sharp jump in the RSI value occurred after an unexpectedly strong earning report.
Formula
Keyboard Adjustment
All thee periods involved in the RSI indicator can be adjusted directly from they keyboard without opening up the preference window. First, select the indicator, then use the up and down arrow keys to adjust the RSI period up or down by 1. To adjust the smoothing period, hold down the shift-key while hitting the up and down arrows. To adjust the momentum period, hold down the Ctrl key while hitting the up and down arrow keys.