Relative Vigor Index

This indicator was developed based the January 2002 Stocks and Commodities article entitled Relative Vigor Index. This indicator is an oscillator built on the basic equation (CL - OP) / (HI - LO). The oscillator is basically in phase with the cyclic component of the market prices.

Presentation
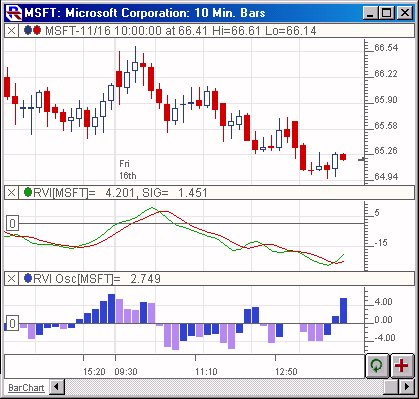
rviChart

Above is a 10-minute chart of the Microsoft (MSFT). The Relative Vigor Index (RVI) is added both as an oscillator (in the lower pane) and as individual lines (in the middle pane with the preferences below).

Formula

rviPrefs


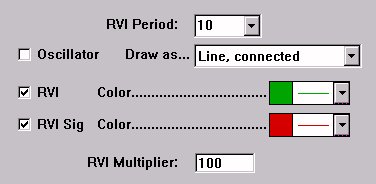
  • Period -Period used in the calculations seen above.
  • Oscillator -If this option is checked, the RVI will be drawn as an oscillator representing the difference between RVI and the RVI signal line.
  • RVI Color - This represents the color, thickness, and style of the RVI line.
  • RVI Sig Color -This represents the color, thickness, and style of the RVI signal line.
No examples. Let us know if you'd like to see one added.
No videos. Let us know if you'd like to see one added.