The Statistics Indicator computes statistical measures (MIN, MAX, AVG, STD DEV) on a price types for a specified period, e.g. 100 period standard deviation of closing price.
1. Minimum - Lower price value over the period specified. 2. Maximum - Highest price value over the period specified. 3. Total - Summation of price values over the period specified. 4. Average - Average of price values over the period specified. 5. Standard Deviation - Standard Deviation of price values over the period specified. 6. Skew - Skew of price values over the period specified. 7. Kurtosis - Kurtosis of price values over the period specified. 8. Higher - Higher value than current price values. This operator does not use the period, and is usually used in the context of "Bars since higher price". 9. Lower - Lower value than current price values. This operator does not use the period, and is usually used in the context of "Bars since lower price". Some common example combinations would be as follows:
To find the smallest range over the past 10 bars: Minimum Hi-Lo Range for preceding 10 periods
To find the 30-period Standard Deviation: Standard Deviation of Close for preceding 30 periods
To find the highest high of the last 55 bars: Maximum High of preceding 55 bars.
To find the lowest low of the last 20 bars: Lowest Low of preceding 20 bars.
To find the number of bars since a lower low was reached. Lower Low (with Resulting Value "Bars Since Lower Low")
To find the average open-close range over last 13 bars: Average Op-Cl Range for preceding 13 bars.
As you can see, the Statistics indicator is very flexible and gives the user the ability to do many things. And the results can be seen in a chart, or can be used in RTL for scanning, backtesting, or custom indicators.
The user specifies the period to use in calculating the statistical values. The period can be either a specific number of bars, or a period since a specific fixed starting date/time.
There are two options for the resulting value. The most common option the "Actual Value" option. This gives the actual value that resulted from the operation (Maximum High, Standard Deviation of Close, etc.). The other option is "Bars Since Value". This option may be used in conjunction with "Higher High" or "Maximum High" for instance. If you chose "Maximum High", and specified "Bars since Maximum Value" as your resulting value, then the result would be the number of bars since the maximum value over that period. On the other hand, if you chose "Higher High", and specified "Bars Since Higher Value", then the result would be the number of bars since the price reached a higher high.
Presentation

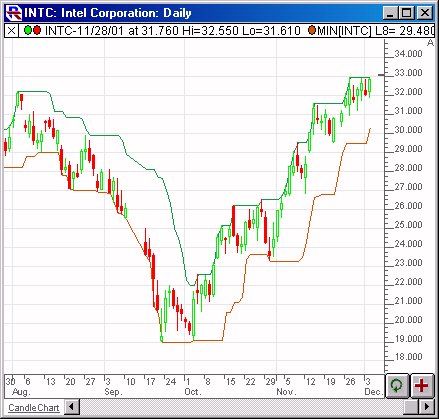
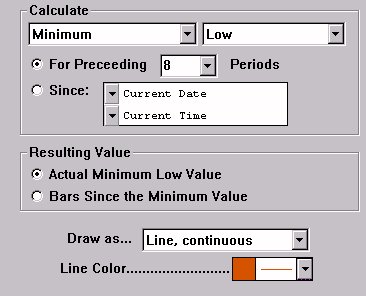
Above is a Daily Chart of Intel (INTC). The Statistics indicator is added twice, once to depict the Highest High For Preceding 8 Periods (in green), and once to depict the Lowest Low For Preceding 8 Periods (in red). The latter is drawn using the preferences specified below.
Keyboard Adjustment
The period of the Statistics indicator can be adjusted directly from the keyboard without having to use the preferences window. Simply select the Statistics indicator and then hit the up arrow on your keyboard to increase the period by 1, or hit the down arrow on your keyboard to decrease the period by 1. The Statistics indicator will adjust dynamically to represent the new period.


