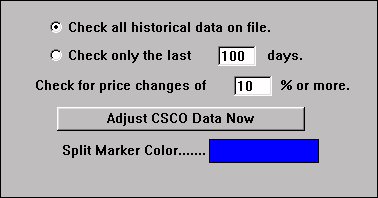
The Split Finder may be added to a chart window or used in a scan to locate stocks with abrupt price changes indicative of stock splits. You may specify a percentage price change from one day to the next that the Split Finder will use to locate possible splits. The default is 10% When the Split Finder is added to a chart window, the title bar of the chart pane indicates if a split has been detected. When the mouse points to the effective date of the split the title bar will indicate the date and the split ratio found. The split ratio is the ratio of the previous day's close to the opening price on the effective date. Rarely will this give an exact number. Typically you may see something like 2.007 to 1 indicating a 2 for 1 split, or 1.504 indicating a 1.5 to 1 (3 for 2) split. If you right click (command-click on Macintosh) in the pane to edit the properties of the Split Finder and the Split Finder has detected a possible split, the Split Finder preferences window will appear with a push button to effect the split adjustment. Clicking this "Adjust Now" button will open the Split Adjustment window with the issue in question selected, the effective date entered for you, and the calculated split ratio shown in the edit boxes. All you have to do is adjust the split ratio, e.g. change 2.007 for 1, to 2 for 1, and click the Split button. Note that 1.5 to 1 works exactly the same as 3 for 2 (or 6 for 4 for that matter). The Split Finder is especially useful when employed in a chart that is the subject of a chart slide show. You can easily go through a series of issues and stop the slide show when the Split Finder indicates a possible split. A semi automatic method of handling splits for those tracking large numbers of issues would be:
- Use a scan to identify all issues whose data indicates a possible split. The "split finder" may be used in the scan request. The scan request language is simply "SPLIT > 0". This will create a quote page of candidate issues.
- Create a daily chart with a price graph and the "split finder" indicator (save this chart so you can use it again when needed)
- Request a slide show using that chart and the quote page created in step 1.
- Advance the slide show manually for each instrument and make the adjustment, if appropriate, as described above.
Investor/RT's split adjustment feature adjusts all historical data (daily, weekly, monthly) on file as well as all tick data for trades that occurred prior to the effective date. An entry is also made in the Trading Notes for the issue, noting the date the split occurred and the ratio. Finally, all open portfolio positions in that stock are automatically adjusted to revise the quantity of shares after the split, and the "opening price" of the position. The cost basis of each position remains unchanged.
Presentation

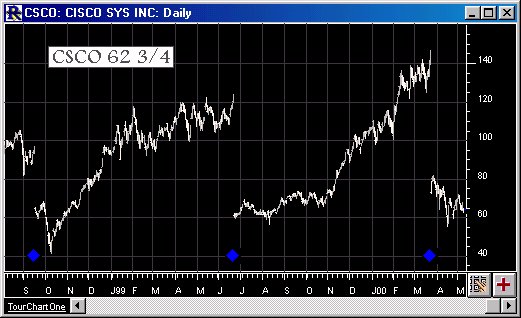
Above is a Daily Chart of the Cisco Systems (CSCO). The blue diamonds correspond to split finder results. The DTN Market Access Historical service used widely by Investor/RT users features split adjusted historical data for equities. This indicator for manually detecting and adjusting for stock splits is now considered a legacy feature.


