Three Line Break Indicator (TLB)
The Three Line Break Indicator calculates columns just like the Three Line Break Charts. There are however a couple of advantages to being able to add TLB as an indicator on a chart. First, you can overlay the traditional bar data on top of the TLB data to see exactly where in time the reversals occurred and the amount of time that was spent in each column. Also, this provides the ability to apply all other technical indicators to PNF data, such as moving averages, reference lines, etc.
Presentation

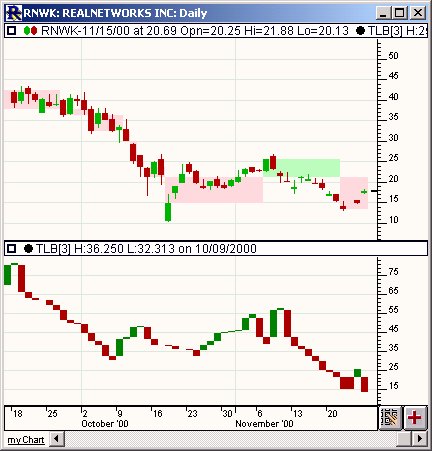
Above is a Daily Candlestick Chart of Adobe (ADBE). The upper pane shows the price data overlaying the expanded (time-based) TLB Indicator. Each green column represents an up column (or line), and each red column represents a down column (or line). The lower pane shows the TLB indicator with the preferences specified below

-
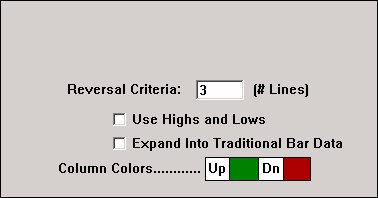
Reversal Criteria -Number of lines needed to cause a reversal.
-
Use Highs and Lows -Specifies whether to use only the closing prices of the bar data, or to use the highs, lows, and closing prices.
-
Expand Into Traditional Bar Data -This option cause the TLB columns to be expanded or stretched in order to conform with the underlying time-based traditional bar data. If this option is left unchecked, then the TLB indicator columns will not necessarily match up with the traditional bars. The feedback in the title bar will indicate the time or date that each TLB column ended. Checking this box will cause each TLB column to be stretched out over the period of time which was used to create the column. For instance, in the chart above, you can see that the first green up column lasted 15 days or bars before a reversal occurred.
No examples. Let us know if you'd like to see one added.


