True Strength Index (TSI)

True Strength is a variation of the Relative Strength indicator. It uses a double smoothed exponential moving average of price momentum to eliminate choppy price changes and spot trend changes. This indicator has little or no time lag. An increasing True Strength value indicates increasing momentum in the direction of price movement.

Presentation
tsi

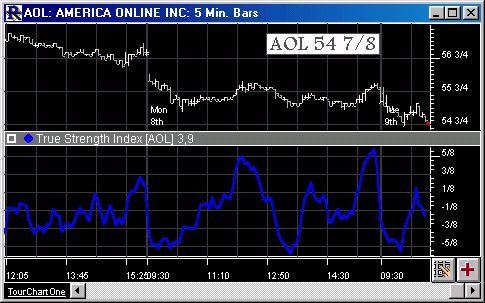
Above is a 5 Minute Bar Chart of America Online (AOL). The bold blue line in the lower window pane represents the true strength index, as specified in the preferences below. The Preferences

Formula

tsiPrefs

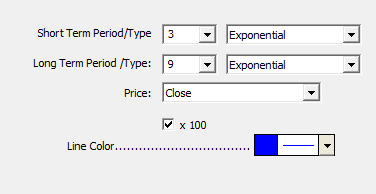
  • Short Term - Second Period used in the double exponential smoothing of momentum.

  • Long Term -First Period used in the double exponential smoothing of the momentum.

  • Price -Price used as input for the calculations seen above.

  • Line Color -Color of the TSI line in the chart.

Better TRIN
This chart plots the Better TRIN indicator as described on the emin-watch.com web site. How to Make a Better TRIN Index in 4 Simple Steps

Read more Download

No videos. Let us know if you'd like to see one added.