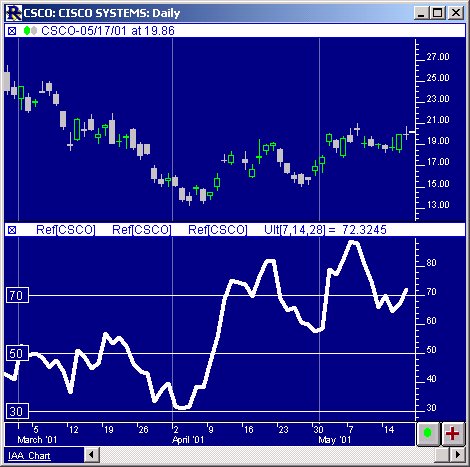
The Ultimate Oscillator was designed by Larry Williams in an attempt to improve on the premature buy and sell signals he observed in other available oscillators. It is documented in the April, 1985 issue of Technical Analysis of Stocks & Commodities. The calculation of the oscillator can be seen above. The Ultimate Oscillator combines three oscillators that represent short-, intermediate- and long-term market cycles (7-, 14-, & 28-periods are recommended). Mr. Williams’ theory is there is a bullish divergence when price makes a lower low that is not confirmed by a lower low in the UltOsc. A bearish divergence occurs when price makes a higher high that is not confirmed by a higher high in the UltOsc. A bullish divergence occurs when price makes a lower low that is not confirmed by a lower low in the oscillator. A bearish divergence occurs when price makes a higher high that is not confirmed by a higher high in the oscillator.
Williams suggests the following regarding buy and sell signals.
- Buy on positive divergence where the low of the oscillator has dipped below 30.
- Sell on negative divergence where the high has exceeded 50.
- Close long positions when the oscillator exceeds 70.
- Close short positions when the oscillator goes below 30.
Presentation

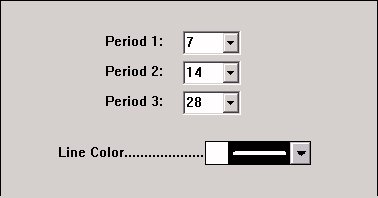
Above is a Daily Candlestick Chart of Cisco Systems (CSCO). The white line in the lower pane represents the oscillator, based on the preferences below. The Preferences


