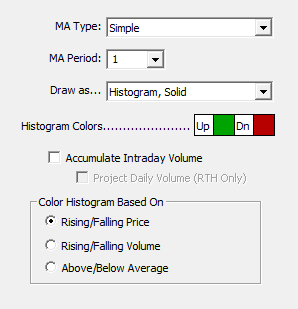
The Volume Analysis Indicator computes a moving average of volume. It provides a more detailed look at volume trends than can be observed using the default volume histogram below price charts. You may use this feature repeatedly to overlay multiple analyses on the same chart. The Moving Average type may be specified as simple, exponential, weighted, Welles Wilder, or Least Square. You may specify the number of periods over which the volume is averaged. Specify a period of 1 to see the raw volume for each bar (no smoothing). The graph may be displayed as a Line or Histogram.
Presentation

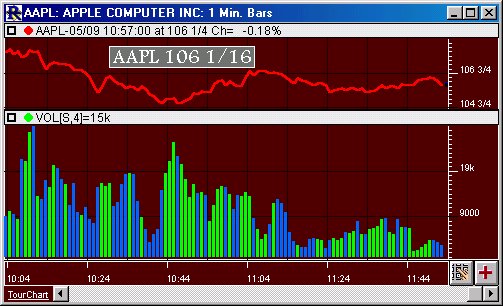
Above is a 1 Minute Line Chart of the Apple Computers (AAPL). The green bars in the lower pane represent volume for up bars, while the blue bars represent volume for down bars. Each bar represents the volume for that 1 minute bar.


