VWAP is the ratio of the value traded to total volume traded over a particular time horizon (usually one session). It is a measure of the average price a stock traded at over the trading horizon.
It is calculated by summing the price & volume of each bar or tick, over the entire session, and then dividing that by the sum of the volume for the session.
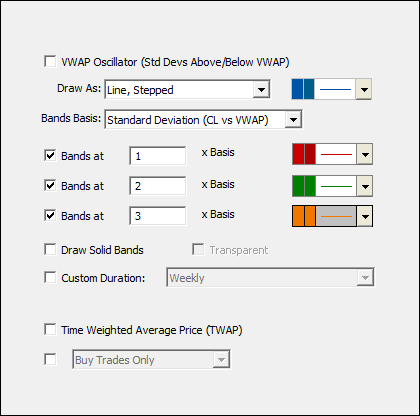
The VWAP Indicator has options to draw one or two bands around the VWAP, as well as a variety of options for computing those bands. The options for Band Basis include:
- Standard Deviation (CL vs VWAP) - The standard deviation between the closing price and the VWAP line, computed on a cumulative basis from the start of the session.
- 1/4 Days Range - One quarter of the range to that point in the day/session.
- 3 x Avg Bar Range - Three times the average range (hi - lo) of last 20 bars..
- Constant $ Value - A constant $ Value above and below the VWAP.
- Proprietary - This option is a work in progress and currently being kept proprietary.
- Percent w/ Time - This option builds bands off both time and price based components. The calculation uses both the number of seconds into the session, along with a percentage of current VWAP, to build the band multiples. This is a nice alternative to the "Standard Deviation" basis for those that want bands to be consistent among periodicities.
Presentation

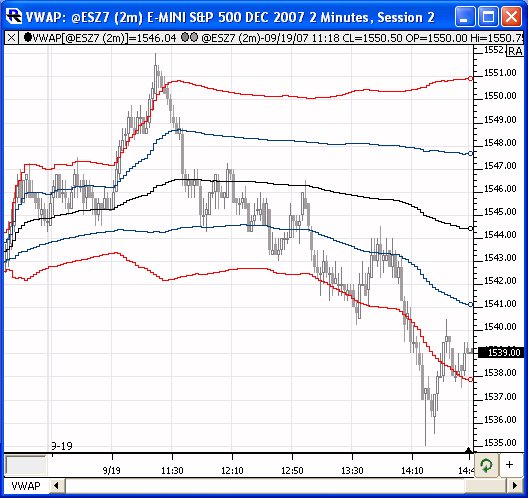
Above is a 2-minute of the S&P Mini Contract (@ESZ7, DTN IQFeed). The VWAP is plotted overlaying the candlesticks. Bands are drawn at 1x (blue) and 2x (red) the standard deviation above and below the VWAP. The preferences seen below were used in this instance.


