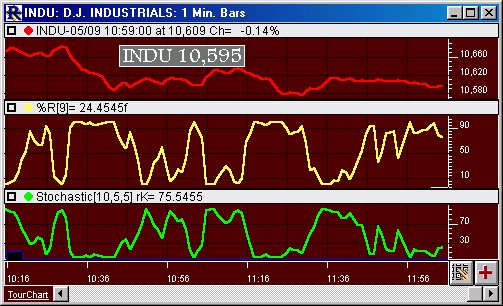
The Williams %Range (%R) Study, is the exact inverse of Lane's Stochastic Study. You may see the relationship between the stochastic and %R very clearly by charting the same symbol in two chart windows that are stacked vertically. Put the %R in one window and stochastics in the other as shown.
Presentation

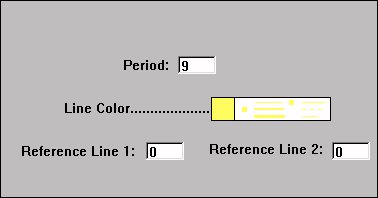
Above is a 1 Minute Line Chart of the Dow Jones Industrials Index (INDU). The yellow line in the middle pane represent the Williams %R line, defined by the preferences below. The green line in the lower pane represents the stochastics Raw K line, seen as the inverse of the Williams %R.


