Zig Zag Oscillator Indicator (ZZO)

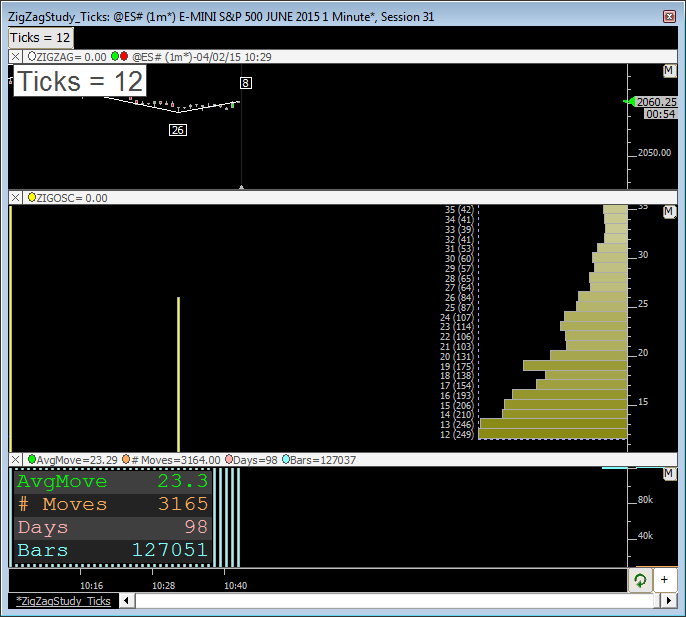
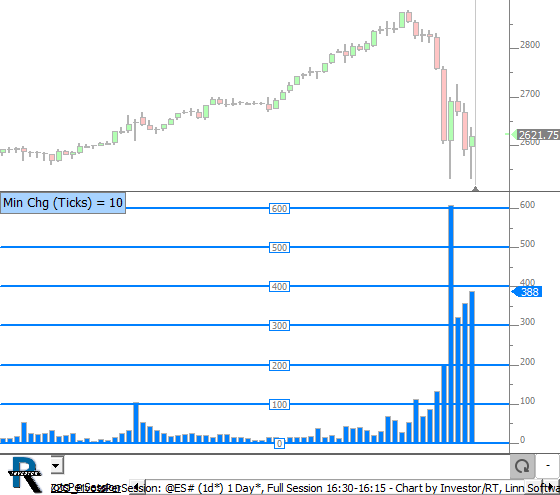
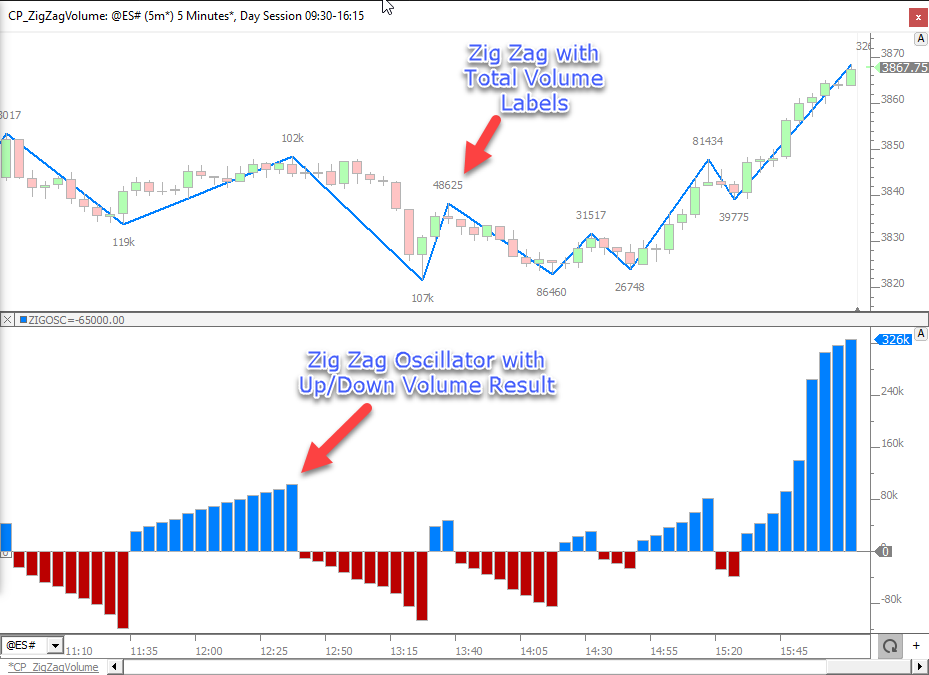
The Zig Zag Oscillator indicator provides a way of viewing the Zig Zag Indicator information in a different form, oscillating about 0. The indicator represents the percent change at each bar of the current price from the base price of the current Zig Zag leg. When the Zig Zag is currently in an uptrend state, the Zig Zag Oscillator will be above 0. Similarly, when the Zig Zag is in a downtrend state, the oscillator will be below 0. Optionally, reference lines may be drawn at any percent change level. If a reference line value of 10% is specified, reference lines will be drawn at both 10% and -10%. It is common to draw the reference lines at the same level as the minimum percent change level, in order to clearly see when prices have reached the minimum required level.

A "Results" option has been added to the Zig Zag Oscillator indicator. This option will default to "Zig Zag Percent Change" which is the result that Zig Zag Oscillator has given in prior releases of Investor/RT. Four new choices provide access to a variety of data elements regarding the Zig Zag Oscillator. Each result option is discussed below: Zig Zag Percent Change This result represents the percent change of the current price (close) from the previous pivot price. Retracement Level This result represents the retracement level of current price in respect to the last leg of the Zig Zag. Pivot Price This result represents the price of the last Zig Zag pivot point. Previous Pivot Price This result represents the price of the next to last Zig Zag pivot point. Direction This result represents the direction of the current Zig Zag leg. A value of 1 represents the current leg is upward trending, while a value of 0 represents that the current leg is downward trending.

Zig Zag Line Price The Zig Zag oscillator indicator has a new result option titled "Zig Zag Line Price", that may be useful in RTL formulas For any bar you can now easily compare the current price to the value of the current Zig Zag leg at that bar. Keyboard Adjustment NA

Presentation

zzochart

Above is a Daily Bar Chart of Real Networks (RNWK). The Zig Zag indicator overlays the bars, drawn as successive black trend lines using the preferences below.

Formula

zzoprefs

  • No Labels - No text label at end of line/leg.
  • End Price - Ending price of each line/leg.
  • Begin Price - Labels the begin price of each line/leg. Label appears on left/begin of each line. Only of use for Trendline labeling.
  • Begin/End Price - Both begin and end prices are labeled at respective position of line. Only of use for Trendline labeling.
  • Change in Price - Change in price of the line/leg is labeled at end of line/leg.
  • Slope (Price/Bar) - Slope measured in change in price divided by number of bars. The change per bar of the line/leg.
  • Number of Bars - Number of bars which the line/leg spans.
  • % Change and Bars - % Change is measured as the difference in price multiplied by 100 and divided by the begin price. To the right of % Change, the number of bars is presented in parenthesis.
  • Change and Bars - Change in price with the number of bars presented to the right and in parenthesis.
  • End Price and Bars - Ending price of the line/leg with the number of bars presented to the right in parenthesis.
  • Prices and Bars - Prices represents the number of prices or tick increments spanned vertically by the line/leg. The number of bars is presented to the right in parenthesis.
  • Slope (Degrees) - Slope measured in degrees from horizontal. Downward sloping lines have a negative slope. Slope will change when zooming or resizing chart. User other slope option (change per bar) for a consistent reading regardless of zooming/resizing.
  • Prices - Number of prices or tick increments spanned vertically by the line/leg.
  • Total Volume - Cumulative Volume of all bars spanned by the line/leg. By default, the bar which begins the line/leg is not considered in this total. A configuration variable ZigIncludeStartBarVol can be turned on to include the start bar volume.
  • Average Volume - Average Volume per bar computed by dividing the Total Volume by the number of bars.
  • Total Delta - Cumulative Delta (buying volume minus selling volume) of all bars spanned by the line/leg.
  • User Specified... - Allows user to enter custom label for the end of each line/leg. Label is presented at the end of each line/leg.
  • User Specified (left)... Allows user to enter custom label for the end of each line/leg. Label is presented at the begin/left of each line/leg.
  • Delta Percent - Total Delta of line/leg as a percentage of total volume of line/leg.
  • Delta Per Price - Total Delta (buy volume minus sell volume) of line/leg divided by the number of prices or tick increments spanned in the line/leg. The average delta required to move price one tick increment.
  • Delta Per Bar - Total Delta divided by the number of bars spanned vertically by the line/leg.
  • Volume Per Price - Total Volume of line/leg divided by the number of prices or tick increments spanned in the line/leg. The average volume required to move price one tick increment.
  • Bars and Time (d:h:m:s) - Number of bars spanned by the line/leg along with the time it took to complete the line/leg to the right in parenthesis. If the time is under an hour, only the minutes and seconds will be presented. The rightmost digit is always seconds. 2nd from the right is always minutes. 3rd from the right is always hours (if line took longer than 1 hour). 4th from right is always days (if line took longer than 1 day).
  • Bars and Time (Secs) - Number of bars spanned by the line/leg along with the time it took to complete the line/leg to the right in parenthesis. Time is presented in number of seconds elapsed from begin of line/leg to the end (number of seconds to complete line/leg).
  • Total Delta (Last VB) - This result looks for the last instance of Volume Breakdown in the chart and will only work if the Volume Breakdown indicator is added to the chart. It sums the per bar values of the Volume Breakdown for all bars within each line/leg. This allows users to label with filtered total delta of each line/leg by placing a volume filter within the Volume Breakdown. Volume Breakdown should have the Accumulate option UNchecked for this to work properly.
  • Total Delta (2nd to Last VB) - This result looks for the 2nd to last instance of Volume Breakdown in the chart and will only work if there are at least two instances of Volume Breakdown in the chart. It sums the per bar values of the Volume Breakdown for all bars within each line/leg. This allows users to label with filtered total delta of each line/leg by placing a volume filter within the Volume Breakdown. Volume Breakdown should have the Accumulate option UNchecked for this to work properly.
  • Delta Diff (Last 2 VBs) - Delta Diff takes the Total Delta (Last VB) and subtracts from it the Total Delta (2nd to Last VB). See descriptions of these two labels above. This option can be used to see the difference between two volume filtered delta values within each line/leg.
  • Time (hh:mm) - Time of day on which the line/leg is completed. Hours and minutes only.
  • Time (hh:mm:ss) - Time of day on which the line/leg is completed. Hours, minutes, and seconds.
  • Date (mm/dd) - Date on which the line/leg is completed. Monthy and day only.
  • Date (mm/dd/yy) - Date on which the line/leg is completed. Monthy, day, and year.
  • Total Trades - Total number of trades which took place during each line/leg. Sum of the total trades within each bar spanned.
  • Average Size - Average size of all trades which took place during each line/leg. Total Volume divided by Total Trades.
  • End Price and Change - Ending Price of each line/leg accompanied by the change in price of the line/leg in parenthesis.
  • Dollar Value Change - The Dollar Value equivalent of 1 traded contract/share. For stocks, the dollar value change will be same as change in price. For futures, the number of prices will be multiplied by the Point Value of each tick increment for the futures contract ($12.50 for ES for instance).
  • Volume of End Bar - Volume of the bar that ends the line/leg.
  • Volume of End Price - Volume of the extreme price of the bar that ends the line/leg. For Zig Zag, on upwards moves, the high price of the ending bar will be presented. Users may turn on a configuration variable ZigZagUseLastHiLo which will force the Zig Zag to end on the last bar with matching highs with several bars hit the same high. When this option is turned on, the volume of the highs of all the matching highs will be summed and presented.
  • Retracement - Percent retracement of each line/leg relative to the previous line/leg. This label is valid only for use with the Zig Zag Indicator. A value of 75% on a line/leg means the vertical price move of the line/leg was 75% of the move of the prior line/leg.
  • Waves - Elliot Wave style labeling where higher highs are labeled with increasing numbers and lower lows are labeled with increasing letters.
ZigZagStudy_Ticks
This chart is documented in the Profiles On Indicators article. This chart profiles the significant moves identified by the Zig Zag indicator and produces data such as the number of moves and average...

Read more Download

ZZO PivotsPerSession (@ES#)
Chart counts the number of moves (zig zag legs) within each session by using MPD on ZZO. Use blue button at top to control the minimum size of moves (in ticks). This chart was uploaded by Investor/...

Read more Download

Pop-up Video Description View
Zig Zag Oscillator: Flex Statistics

This video highlights a powerful new result option added to Zig Zag Oscillator titled Flex...

 Watch
Using Zig Zag Oscillator in RTL

This video demonstrates how to manage the usage of the forward-looking Zig Zag Oscillator within...

 Watch
Zig Zag of Cumulative Delta

This video describes how to add the Zig Zag Indicator to the Volume Breakdown indicator...

 Watch