General Overview
Investor/RT's Custom Profile Chart combines the abundant data possibilities of custom indicators and the flexibility of quotepages into a customizable, visual display. In a nutshell, the Custom Profile Chart allows you to take any list of securities, perform any numerical calculation available on the data for those securities, filter and sort the results, and provide them in a bar graph profile format. The data source can be something as simple as the daily percent change, or the most complex custom expression you can dream up.
Below is a Custom Profile Chart, simply showing graphically the daily percent change for a list of securities. In this example we have filtered out the Highest and Lowest 10 results and charted them in ascending order, with the largest percent gainers (highest values) at the top, and the lowest percent losers (lowest values) at the bottom. Positive values are assigned the color of green, and negative values are red, allowing positive and negative percent change values to coexist on one scale.

The Custom Profile chart is extremely flexible, allowing you to chart a numerical value or calculation on any list of securities, and even filter out the highest and/or lowest results, and present them to you in ascending or descending order. Investor/RT performs the following sequence of steps when composing your Custom Profile...
- Extracts the list of ticker symbols from the QuotePage you have selected.
- Computes a numerical data value for each ticker, based on the data source which is chosen. If a Data Column is selected, then Investor/RT simply pulls that data from the database. If a Custom Indicator is chosen, then a value is computed based on the Custom Indicator expression and the periodicity.
- The resulting values are then sorted. If "All" ticker symbols are to be shown, the values are sorted based on the "Rank" criteria in the preferences...either Ascending, Descending, or Alphabetically. If the Highest (or Hi and Lo) values are to be shown, the values are sorted in Descending order. If the Lowest values are to be shown, then the values are sorted in Ascending order.
- Now the list is filtered if necessary. For instance, in the example above, the Highest and Lowest 10 are to be filtered out and displayed.
- Now the results are shown graphically.
- If the "Recalculate" option is checked, then a timer is set and the chart will automatically refresh itself based the latest data and the refresh period.
As you move your cursor over the chart, you will notice that the feedback in the message bar changes. For instance, if you placed your cursor over the RNWK bar, you would see something like "RNWK = 39 1/2, %Change = 6.21". The message supplies you with information related to the ticker symbol row over which you have your cursor. The message includes the ticker symbol, the last price, the data source used, and the data source value for that ticker.
In the upper right hand corner of the chart you will find a refresh button (semi-circle with an arrow on the end). You can refresh (recalculate) the chart at any time by simply clicking on this button. If you have specified for the chart to automatically recalculate itself, then this button will just reset the timer and the automatic recalculation will continue.
The four divisions of the chart are quarter divisions of the largest value in the chart. Both positive and negative values are shown on the same scale, and are differentiated by their color. Each quarter scale division is marked with a data value in the horizontal scale at the bottom of the chart. The red vertical line seen in the chart above is an optional reference line. You can draw one reference line at any data level in your chart.
To help further explain exactly how the profile works, each component of the Custom Profile Preferences window is explained below, followed by an explanation of the toolbar buttons and the popup menus.
Custom Profile Preferences
The Custom Profile Preference window is show below. This window can be accessed in one of 3 ways....either by double clicking in the window, by right clicking (command-click on Mac) and choosing "Preferences", or by clicking on the "Chart Preferences" button in the Custom Profile toolbar.

-
QuotePage
The QuotePage you select provides the list of symbols which will be used to create the chart. You can create as may QuotePages as you would like. If you change the target QuotePage (by adding or deleting symbols) and then save that QuotePage, the Custom Profile will automatically be adjusted to reflect the changing list of securities. Learn more about QuotePages.
-
Profile Data Source
The Profile Data Source dictates the data which will be used for each symbol in the QuotePage to compose the Custom Profile. The data may be calculated from a complex expression in the case of a Custom Indicator, or simply pulled direction from the database in case of a Data Column.
-
Custom Indicators
The first Data Source option is the Custom Indicator. A Custom Indicator is essentially any expression which you can create with the Investor/RT RTL (Real-Time Language). Learn more about Real Time Language. The "New" and "Edit" buttons to the right of the Custom Indicator allow you to either create a new Custom Indicator, or edit the one selected in the list.
-
Data Column
The second Data Source option is the Data Column. A Data Column supplies a list of numerical QuotePage columns, such as Percent Change, Bid-Ask Spread, and Times Average Volume. This Data Source option gives you quick and easy access to these database fields without having to go to the trouble of creating a Custom Indicator.
-
Period
The Period control allows you to select the Periodicity of data on which the Custom Indicator will be calculated. For instance, if your Data Source is the Custom Indicator of (CL - CL1) then a Daily Periodicity would result in the use of today's and yesterday's closing prices, while a 30 Minute Periodicity would result in the closing prices of the most recent 30 minute bars. Period is only relevant if you are using a Custom Indicator as your data source. It will have no effect on Data Column values.
-
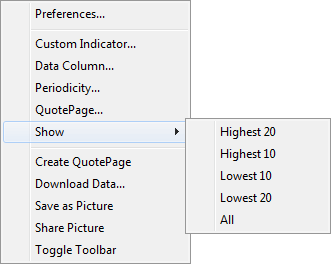
Show
This group of controls allows you to filter out a subset of the resulting values in order to limit the results that will be displayed in the Profile. You can choose to show the Highest 10, the Lowest 21, the Hi and Lo 12, All, or anything in between. If you choose "Highest", then the results will be ranked in Descending order, with the highest value at the top. If you choose "Lowest", then the results will be ranked in Ascending order with the lowest values at the top. If you choose "Hi and Lo", the results will be ranked in Descending order, and you will get the extreme computed values. For instance, if you chose to show the Hi and Lo 10, you will see 20 results, with the top 10 being the highest 10 values, and the bottom 10 being the lowest 10 values.
-
Rank
This options is only available when you choose to Show All results. In this case, you can choose to either rank the results in Alphabetical, Ascending, or Descending order.
-
Recalculate every __ minutes
If you check this option, the Profile will automatically refresh itself based on the latest data. The frequency of recalculation is based on the number entered in the list box. You can choose to enter any number, 0.10 (6 seconds) or greater. There is also a Refresh button on the upper right corner of the chart which can be used to refresh the chart at any time.
-
Draw Reference Line at __
If you check this options, a vertical Reference Line will be draw in the chart at the value entered. If the Reference Line is outside of the values represented in the Profile, the reference line will not be seen.
-
Log Scaling (Base 10)
If you check this option, all values seen in the resulting profile will be the base 10 log of the data. If any data has a value of less than one, logarithmic scaling is not possible and will be automatically turned off.
-
Colors (Background, Positive, Negative)
These controls allow you to specify the colors of the background, the bars representing negative values, and bars representing positive values. Positive and negative values are charted on the same scales, therefore it is important to represent the two values with different colors for differentiation.
Custom Profile Toolbar
 The Custom Profile Toolbar gives you quick and easy access to several features which are listed and explained below. If at any time, you close the toolbar and would like to get it back, you can do so by going to the windows menu, and choosing "Toolbars : Cust Profile Toolbar".
 Custom Profile Preferences - This button brings up the toolbar preferences. This options is also available by double clicking in the chart or choosing Preferences from the Popup Menu.
  Save Chart - This button saves the Custom Profile Chart.
  Show QuotePage - This button will bring up the QuotePage that is associated with the Custom Profile. You can then add or delete symbols from the QuotePage . When you save the underlying QuotePage , the Custom Profile will automatically refresh itself to reflect the update.
  Change QuotePage - This button will provide you a list of all available QuotePages and allow you to change the QuotePage that the Custom Profile uses for it's list of securities.
  Show Custom Indicator - This button will bring up the Custom Indicator associated with the chart and allow you to edit it. When you save your changes, the Custom Profile will automatically refresh to reflect the update.
  Change Custom Indicator - This button will bring up a list of available Custom Indicators. Select the Custom Indicator you would like to use in your Custom Profile. You can repeatedly select one and hit apply to get quick looks at the values of each.
  Change Chart Timeframe - This button allow you to change the timeframe (or periodicity) on which the Custom Indicator is being calculated.
  Change Data Column - This button gives you a list of numerical QuotePage data columns from which to choose as the data source for the Custom Profile.
  Change Toolbar Style - This button is used to change the size and orientation of the toolbar.
  Download Data - This button will provide you with the Download Data window so that you may download historical data on your target QuotePage.
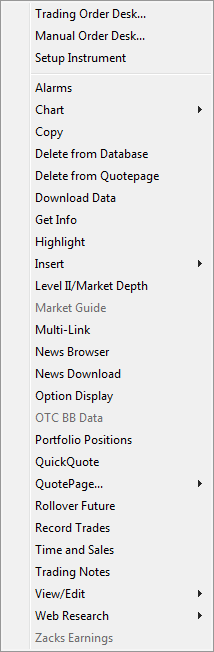
Custom Profile Popup Menus
You will get one of two popup menus when you right click (command-click on Mac) in the Custom Profile window, depending on where you click. If you right click on top of an actual ticker symbol, you will get a popup menu which provides functions relative to that particular symbol. If you right click anywhere else in the window, you will get a popup menu related to general Custom Profile functions. The two popup menus are shown to the left, with the general popup menu to the right of the taller ticker symbol popup menu. Most of the functionality of the general popup menu is described in the preference and toolbar sections above.