Submitted by linnsoft on Tue, 04/23/2013 - 20:47
The Charts, General window, as seen below, is used to specify several advanced charting preference settings . . .
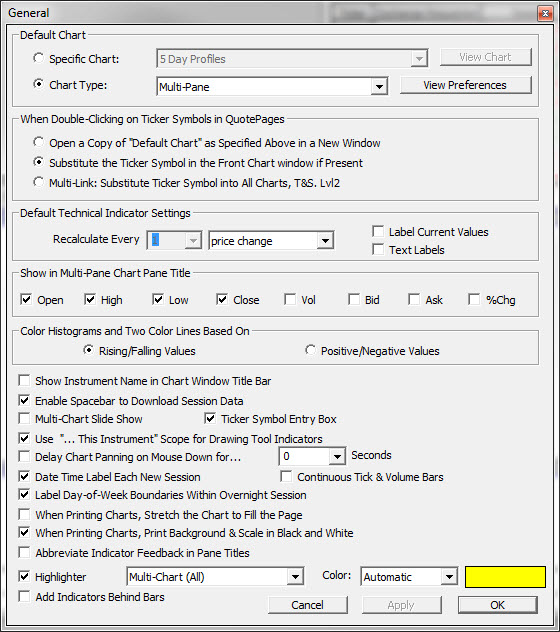
- Default Chart - The "Default Chart Object" menu is used to specify a default chart object that is used to open new chart windows when a chart is requested for a symbol in a quote page or a quick quote window. For example, if you always want to see certain technical indicators, create a chart object with those indicators and save the chart under a name like "My Default Chart". Then specify "My Default Chart" as the default chart object. Whenever you double-click on a ticker in a quote page, Investor/RT will open "My Default Chart" and insert the ticker you clicked on into the chart. Leave the "Default Chart Object" checkbox unchecked if you wish the default chart to be a simple chart of the instrument.
- When Double-Clicking on Ticker Symbols in Quote Pages . . . - This dictates the default behavior response when double-clicking on a ticker symbol within a quotepage. The choices including opening a new default chart, substituting the ticker symbol into the front most chart, or multi-linking the symbol into all open charts, Time and Sales, and Level II windows.
- Default Recalculation Frequency for Technical Indicators - This is the recalculation frequency that will be inherited by technical indicators when they are first added to Traditional Charts. This frequency can then be changed on the instance level.
- Show in Traditional Chart Pane Titles . . . - When chart windows are open, pointing the mouse to a particular point on the chart causes the data for that date/time to be displayed in the chart window pane titles. You can control which data items are shown by checking the appropriate boxes in the "Show Data..." section of this window.
- Multi-Chart Slide Show - This checkbox allows you to specify whether slideshows will use only the one chart that is in focus, or all open charts. If this checkbox is checked, then all charts will get involved in the slideshow.