Fibonacci Arcs are displayed by first drawing a trendline between two extreme points, for example, a trough and opposing peak The arcs are drawn, centered on the second extreme point, so they intersect the trendline at the Fibonacci levels specified. The interpretation of Fibonacci Arcs involves anticipating support and resistance as prices approach the arcs. A common technique is to display both Fibonacci Arcs and Fibonacci Fan Lines and to anticipate support/resistance at the points where the Fibonacci studies cross. Note that the points where the Arcs cross the price data will vary depending on the scaling of the chart, because the Arcs are drawn so that they are circular relative to the computer screen.
Presentation

Above is a 3-Minute Bar Chart of Cisco (CSCO). The Fibonacci Arcs are drawn with the colors and levels specified in the preferences below.
Keyboard Adjustment
The keyboard can be used to move the Fibonacci arcs to the right and left. First, click on the chart. Then hit the tab key repeatedly until you notice your Fibonacci Arc trendline is selected. Then, press the right or left arrow keys on your keyboard to move the entire Fibonacci line right or left one bar. If you would like to move only the endpoint, then hold down the Ctrl key while pressing the right or left arrow keys. If you would like to move only the beginning point, then hold down the Shift key while pressing the right or left arrow keys.
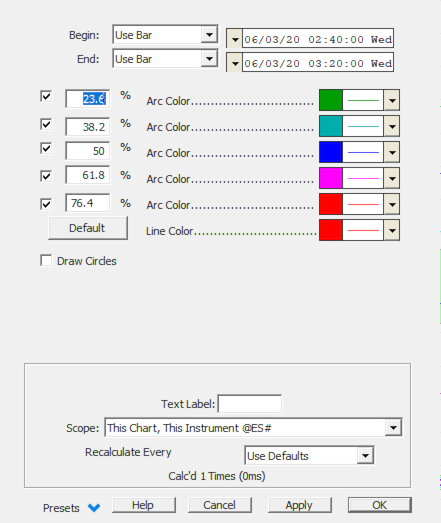
 Dictates whether that Fibonacci Arc level will be draw in the chart.