Fibonacci Projections, or Fan Lines, are displayed by drawing a trendline between two extreme points, for example, a trough and opposing peak. Then an "invisible" vertical line is drawn through the second extreme point. Three trendlines are then drawn from the first extreme point so that they pass through the invisible vertical line at the Fibonacci levels of 23.6 %, 38.2 %, 50.0 %, 61.8 %, 76.4%, or whatever customized levels you prefer.
Presentation

Above is a Daily Chart of the S&P 500 Future Contract (SP1M). The diagonal red line represents a trendline between two extreme points, based on the date-time ranges specified below. The three horizontal trendlines represent the Fibonacci Levels selected in the preferences below.
Keyboard Adjustment
The keyboard can be used to move the Fibonacci points to the right and left. First, click on the chart. Then hit the tab key repeatedly until you notice your Fibonacci Projection lines are selected. Then, press the right or left arrow keys on your keyboard to move the entire Fibonacci line right or left one bar. If you would like to move only the endpoint, then hold down the Ctrl key while pressing the right or left arrow keys. If you would like to move only the beginning point, then hold down the Shift key while pressing the right or left arrow keys.
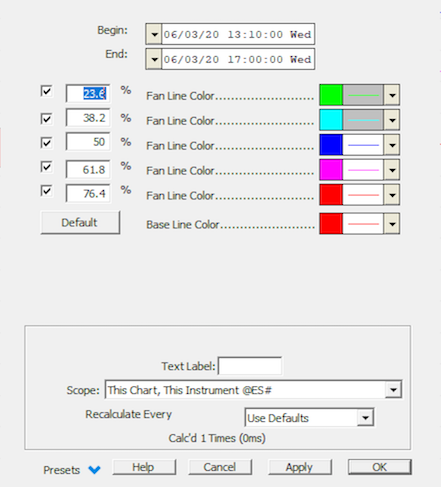
 - Dictates whether that projection lines will be draw in the chart.