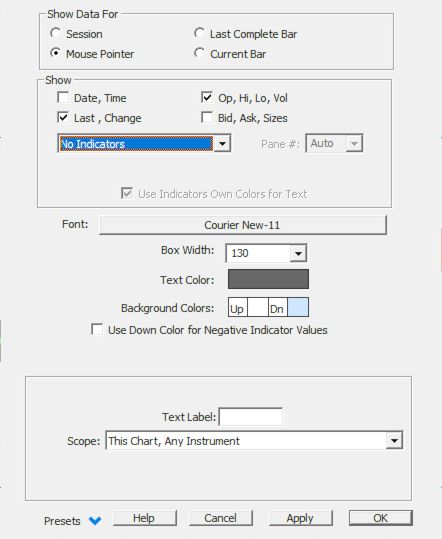
Info Box is a chart drawing tool that provides a tabular display of an instrument's market data and, optionally, the values of technical indicators included in a given pane (or all panes) of a chart.
The "Show data for" section of the preference window determines which bar the instrument data is displayed for. It includes 4 options:
- The "Current Bar", i.e. the bar in progress
- "Session" is similar to Current Bar, except the Open, High, Low & Volume information are the ones valid for the entire (chart) session
- The "Last Complete Bar"
- "Mouse Pointer", i.e., the bar where the mouse pointer hovers
The "Show" section of the Preferences window controls the instrument data and/or indicator being displayed
There are 4 predefined choices for instrument data content. Any or none of these can be set up for display:
- Date, Time
- Last Price and Change
- Open, High, Low, Volume
- Bid/Ask and Bid/Ask Sizes
In addition, there are multiple choices for the kind of technical indicator content to be shown:
- All Indicators in the Chart (whatever their pane location)
- One pane's indicator: If "Auto" is selected, then the Infobox includes the Indicators in the Pane containing the Info Box. Otherwise, select the Pane Number that contains the indicator value you wish to display
- No Indicators
- All Trendlines
- All Signals: it includes a dedicated display Filter "If True during last X bars"
You can easily adjust the content settings by right-clicking on the Info Box to edit the preferences, or you can ctrl-up arrow or ctrl-down arrow to cycle through all of the content variations visually using the keyboard.
Note: Additional settings (Indicator label selection, text font and color controls, display format, etc) are discussed in the Preference Tab
Adding an info box to a chart
Default Location: By default, info boxes are positioned in the upper left corner of the window pane. Like any other indicators, Info Boxes can be dragged and dropped from one pane to another using the mouse. Preferences for the info box can be accessed by right-clicking inside it. An Info Box can be "selected" by clicking once inside the box. The border rectangle is drawn slightly thicker when the box is selected. The height of the info box is determined by the software based on the content requested. The width of the info box can be specified by the user in the preferences and can be adjusted using the keyboard.
Adjusting the position of the infobox with arrow keys: When selected, a variety of keyboard shortcuts are provided for moving the box's position inside the window pane, or expanding/contracting the width of the info box (See the Keyboard adjustment section below for more information)
Adding multiple Infobox
Multiple info boxes can be added to the same or different panes within a chart. For example, you could have one info box showing the current values of an instrument, and another info box setup to show the values of all technical indicators in the chart based on the bar where the mouse is pointing.
Some final Tips:
- You want to add a specific custom indicator value, but don't want to display the corresponding line or histogram on that chart: just add it using the "invisible" chart style (or on a subpane having been minimized) and make sure you add a custom text label to clearly identify it
- You have multiple instruments on the same chart: make sure you "associate" the infobox with the right instrument when adding it to the chart
- You want to sort different prices or indicator values: this is not possible with the InfoBox, i.e., you need to use the Quoteboard indicator
Presentation

Above is a daily candlestick chart with an Info Box in the upper window pane. The Info Box is setup to show all indicators, the CCI, the moving average, and the volume of the bar at the mouse pointer.
Keyboard Adjustment
When an Info Box is "Selected": Left arrow key moves the Info Box 1 pixel left. Right arrow key moves the Info Box 1 pixel right. Up arrow key moves the Info Box 1 pixel up. Down arrow key move the Info Box 1 pixel down. Hold down the arrow key for continuous movement of the box in the desired direction. If the Shift key is held down while using the up/down/left/right arrow keys, the movement increment is 5 pixels at a time for faster movement of the box in the desired direction. If the Ctrl key is held down, the left and right arrow keys will contract and expand the width of the Info Box. Hold down the ctrl and arrow keys together for continuous width adjustments. Use the Ctrl key in conjunction with the up and down arrow keys to adjust the display content of the Info Box.