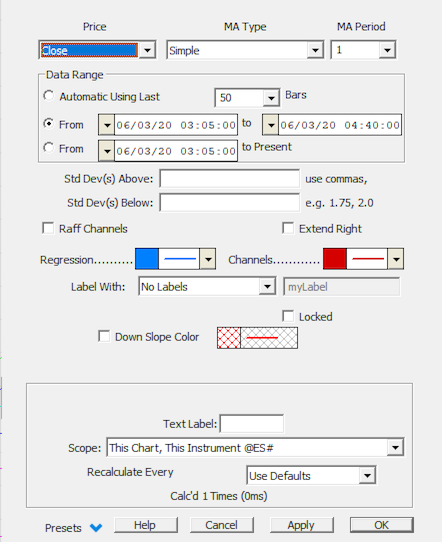
Linear regression is a statistical tool used to predict the future from past data, and commonly used to determine when prices are overextended. The Investor/RT Linear Regression tool uses a least square method to plot a "best-fit" straight line through a series of data points. The data points used as input can be any of the following: Open, Close, High, Low, Hi+Lo/2, Hi+Lo+Cl/3, OHLC/4, %Change, or Op+Cl/2. These data points can be optionally pre-smoothed prior to construction of the best-fit line. If no smoothing is desired, simply chose a smoothing period of 1.
Several options exist for selecting the range of prices that will be included in the regression analysis (Data Range). The first option "Automated using the last X bars", results in an automated moving regression line, always using the most recent X bars. The second option, "From dd/mm/yy hh:mm:ss to dd/mm/yy hh:mm:ss", allows the user to specify a specific start and end point in time. The third option, "From dd/mm/yy hh:mm:ss to Present", is another automated moving regression line, always beginning at a specific fixed starting bar, and always ending at the most recent bar. The data range will expand as time moves forward.
Click the linear regression icon  in the charting toolbar to enable the linear regression drawing tool. Mouse down in the window at the point you'd like to begin your regression line. Hold your mouse button down while you drag the drawing tool between the two points of interest. When you release the mouse button Investor/RT draws the regression line. As an option, you may choose to draw straight band lines parallel to the regression line. The bands are drawn a user-specified distance above and below the regression line. The distance is specified by the user as the number of standard deviations away from the regression line. You are not limited to drawing only one channel line above and below the linear regression line. You may specify multiple levels simply by separating them with a comma. For instance, you may have: Standard Deviation(s) Above: 1, 1.5, 2 Standard Deviation(s) Below: 1, 1.5, 2 And three channels will be drawn, at 1, 1.5, and 2 standard deviations from the regression line respectively. The standard deviation value is computed using the same range of data values used in determining the regression line (Data Range). The values specified in the preferences are multipliers of this standard deviation value, used to compute the distance(s) of the channels from the regression line.
If the Raff Channels checkbox is checked a different method will be used to compute the bands. Developed by Gilbert Raff, this method finds the maximum distance between any closing price and the regression line. This distance is then used as the basis for the channels. The channels are drawn parallel to the regression line, at a distance above and below the line equal to the maximum distance computed. The upper channel is then used for support, while the lower channel is used for resistance. Again, you can specify multiple levels, separated by commas. The levels will be used as multipliers of the standard Raff channels. To simply draw the standard Raff channels, specify multipliers of 1 for both the above and below channels.
The Linear Regression Study can optionally be extended to the right with the "Extend Line to Present" option. This will project the line forward to the right edge of the chart. The begin and ending points of the trendline may still be clearly seen as small dots in the line. These points can be dragged to a new position in the price data. When a drag occurs, the regression is recomputed and a new regression line is drawn considering the new data range. When the "From dd/mm/yy hh:mm:ss to Present" data range option is being used, then only the begin point can be dragged to a new fixed location. The begin point will then remain fixed while the end point will adjust to the most current bar as new bars form. The following approximations offer a few rules of thumb for using the standard deviation settings:
- Plus or minus one standard deviation takes in 68.3% of all expected outcomes (historical price moves)
- Plus or minus two standard deviations takes in 95.4% of all expected outcomes (historical price moves)
- Plus or minus three standard deviations takes in 99.7% of all expected outcomes (historical price moves)
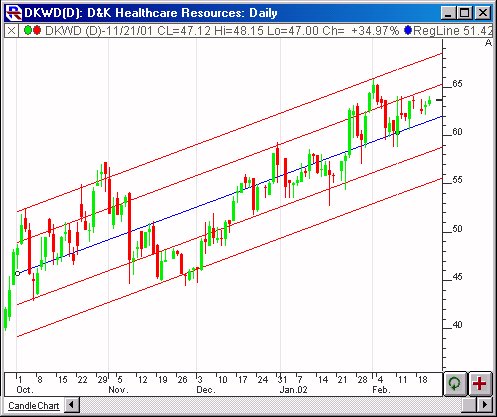
For example, excursions of price more than 2 standard deviations above or below the regression line represent an unlikely event (less than 5% probable). Such excursions usually represent overbought or oversold conditions.
Presentation
The "Use Last X Bars" option allows you to create a dynamic linear regression line. The line will always be based on the last X bars in your chart. If you are watching a 1 minute chart, the regression line will dynamically change based on changes in your most recent 1 minute bar. When a new bar is formed, the line will be redrawn based on the most recent data. The regression line will always be considering the most recent bars and the latest ticks.
Click the linear regression icon in the charting tool palette to enable the linear regression drawing tool and hold your mouse button down while you drag the drawing tool between the two points of interest. When you release the mouse button Investor/RT draws the regression line. As an option, you may choose to draw straight band lines parallel to the regression line. The bands are drawn a user-specified distance above and below the regression line. The distance is specified by the user as the number of standard deviations away from the regression line.
The following approximations offer a few rules of thumb for using the standard deviation settings:
Plus or minus one standard deviation takes in 68.3% of all expected outcomes (historical price moves) Plus or minus two standard deviations takes in 95.4% of all expected outcomes (historical price moves) Plus or minus three standard deviations takes in 99.7% of all expected outcomes (historical price moves)
For example, excursions of price more than 2 standard deviations above or below the regression line represent an unlikely event (less than 5% probable). Such excursions usually represent overbought or oversold conditions
Keyboard Adjustment
The keyboard can be used to move the Linear Regression Line endpoints to the right and left. First, click on the chart. Then hit the tab key repeatedly until you notice your Linear Regression line is selected. Then, press the right or left arrow keys on your keyboard to move the entire Regression line right or left one bar. To move the trendline up or down, press the up and down arrows on the keyboard. If you would like to move only the endpoint (rightmost), then hold down the Ctrl key while pressing the right or left arrow keys. If you would like to move only the beginning point, then hold down the Shift key while pressing the right or left arrow keys.