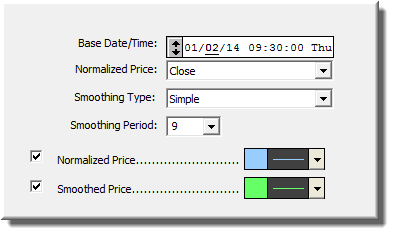
The Normalized Price indicator graphs the price movement of an instrument using 100 as the base value for a user specified base date/time. The normalized value for each bar after the base date/time is the percent of the base price expressed as a whole number. (i.e. 100 times actual price divided by actual base price) This indicator shows the percentage move in price relative to some fixed starting point. For example, if you add this indicator to a daily chart using 12/31/99 as the based date, the indicator line will show you how the issue has performed since the beginning of year 2000. Values above 100 indicate the percentage increase in price since the beginning of 2000. For example, a value of 115 means the price has increased 15% since the base date, while a value of 82 would indicate a decline of 18% since the base date. The "price" graphed can be any of the standard Investor/RT price values: close, high, low, high + low average, or high + low + close average. An optional smoothing can be applied to the resultant graph. For example, if the actual closing prices beginning at the base date/time were: Another purpose of the Normalized Price indicator is to provide a means of easily comparing the price action of two or more instruments since some fixed starting point. When a chart window contains two or more instruments, you may create normalized lines for each of the instruments and add them all to the same pane. Be sure to use the same base date/time in all normalized price indicators.
Presentation
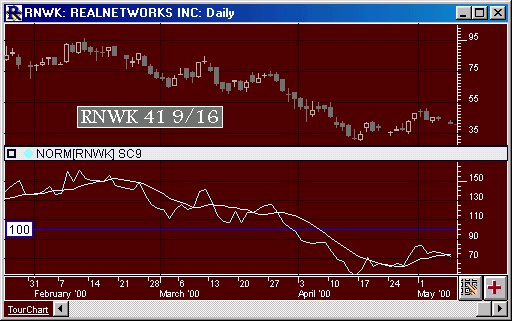
Above is a Daily Candlestick Chart of an Real Networks Corporation (RNWK). The aqua line represents the raw normalized value, while the white lines represents a moving average of the raw normalized values, based on the preferences below.