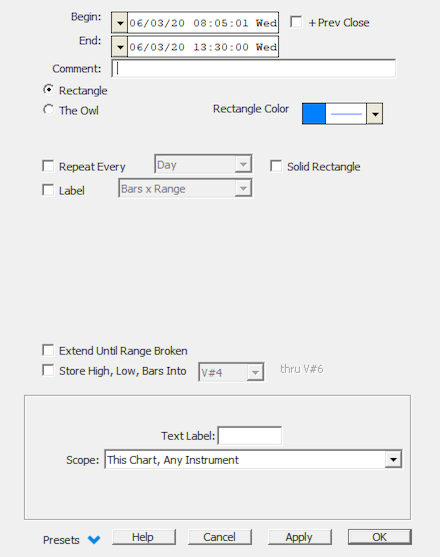
The Rectangle tool is a chart drawing tool used to highlight a user-specified range of time in the chart by enclosing that portion of the chart inside a rectangle. Rectangles may be drawn in chart windows of any periodicity. Activate the rectangle drawing tool by clicking on the rectangle tool in the chart toolbar. Move the mouse pointer into the chart window (the cursor changes to a pencil). Push down the mouse button and drag the mouse to form a rectangle that encompasses the period of time you wish to highlight. When you release the mouse, Investor/RT redraws the smallest rectangle it can that includes the range of date/time and all realized prices during that period. An optional user comment is used to title the rectangle in the upper left corner. You can edit the rectangle to change the position, the comment, the color and line thickness used to draw the rectangle. Turn off the rectangle drawing tool by clicking again on the rectangle tool on the charting toolbar. You can also add rectangles using the "Add a Technical Indicator" button on the chart toolbar. When the Add Indicator window appears, pick Rectangle, enter the settings for the desired rectangle, including the dates (and optionally the times) to include inside the rectangle, and click OK to add the indicator to the current chart window.
Presentation

Above is a 5 Minute Line Chart of the Nasdaq Composite Index (COMPX), along with a 5 Minute Candlestick Chart of the Dow Jones Industrials Index (INDU). The rectangle tool was used to draw a rectangle on both charts chart panes.