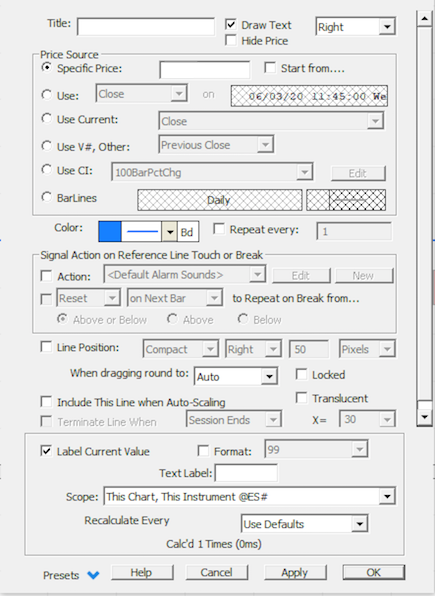
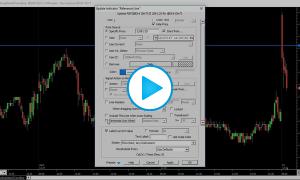
The Reference Line indicator draws a horizontal line on the displayed chart according to the preferences of the user. The line can be drawn according to a trading value on a particular day, an alarm value, or an arbitrary value of the user's choosing. This tool may be used repeatedly to overlay several reference lines on a given chart. Using the mouse you may drag a reference line to adjust its reference value . The value is based upon where the tip of the mouse is positioned when you "drop" the reference line. Dragging a reference into a different pane moves the reference line to the new pane while retaining the same reference value. Keyboard Adjustment Reference lines can be adjusted directly from the keyboard without opening the preferences window. First, select the reference line, then hit the up or down arrows to move the indicator up or down. The amount that the line will move up or down is based on the display setting in the indicator preferences labelled "When dragging round to:". If this is set to "99", then the reference line will round to whole numbers and the up and down arrows will adjust the line by $1 at a time. If this is set to "99.9", then the arrows will adjust the line by $0.10 at a time. If this is set to "99.99", then the arrows will adjust by $0.01 at a time. To force the line to move by $1 increments regardless of display setting, hold down the shift key while hitting the up and down arrows. To force the line to move by $0.10 increments regardless of display settings, hold down the Ctrl key while hitting the up and down arrow keys.
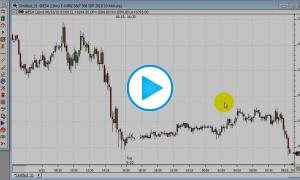
Reference Lines: Start Date/Time video
You can begin a new reference lines on any given bar, and drag and drop the reference lines starting point not only between prices, but also between starting bars. A checkbox at the top right of the Reference Line preference window titled "Start From" enables this option. Once turned on, simply drag the reference line to any given bar and the line will draw from that bar forward. Once such a line has been added to the chart, simply right-click on that line and "Add Button". The resulting button will allow the user to simply click on any price on any given bar and a line will be drawn at that price projecting from that bar forward, and can then be dragged to any other price and bar combination.
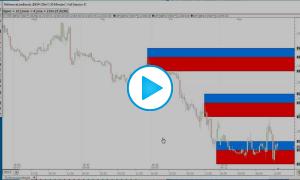
You can also use the Reference Line indicator for the drawing of a band between any two prices. This functionality is supplied via the embedded Bands available within the color control of Reference Lines, and further via a new option of "Above (Filled)" within bands. As an example, if a line was drawn on a chart of ES at a price of 2070.00 and the bands were turned on with "8 Ticks: Above (Filled)", then a solid band will be drawn from 2070.00 up to 2072.00. The height of the band may be adjusted from the keyboard by simply selecting the line, then using the shift-mousewheel ( or shift-up/down arrow). This option may also be used in combination with the new Start Date/Time option to drag a banded reference line between prices and bars. Within the band setup, then second band now provides a "Below (Filled)" option as well. This option will draw a solid band below the primary line at the height specified. This filled band below can be combined with a filled band above, each with its own unique height. The height of the band below may also be adjusted from the keyboard using ctrl-mousewheel (or ctrl-up/down arrow). So for a line setup with filled bands both above and below, select the line and use the mouse scrollwheel to move the line up or down, and hold down the ctrl key while operating the scrollwheel to adjust the height of the band below, or hold down the shift key while operating the scrollwheel to adjust the height of the band above. The magnitude of all three band options may now be specified as C# or V# and therefore adjusted with a Button Indicator.
Reference Line Band Below Filled
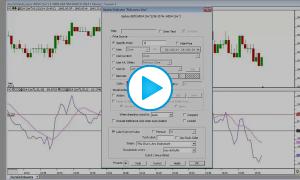
When filled bands are turned on, by default, a line will be drawn on the border of the band using the same color as the primary reference line. The "Label Current Value" in scale will also be drawn using the same reference line color. Users have a couple of additional color options on this front if this setup is not ideal. Users may check the "Use Scale Color" option below the Reference Line preferences to draw the label using the scale color instead of the line color. Also, a new configuration variable is available titled RefBandLabelLineColor. This config defaults to true but when set to false, the line and label drawn at the edge of the bands will instead use the corresponding band color.
See Also
Presentation

Above is a 2t Renko Chart of the ES with a variety of implementations of Reference Lines added showing filled bands, drawing positions, and repeating options.