Please check first this Trading System Tools page for a global overview insight of all Investor/RT backtesting features.
Trading System Indicator requires the Trading Systems Package.
The Trading System Indicator (TSYS) charts the actions of a Trading System built using the Investor/RT Trading System Tools. The TSYS can operate on bars of any periodicity, both historically (backtesting) and going forward.
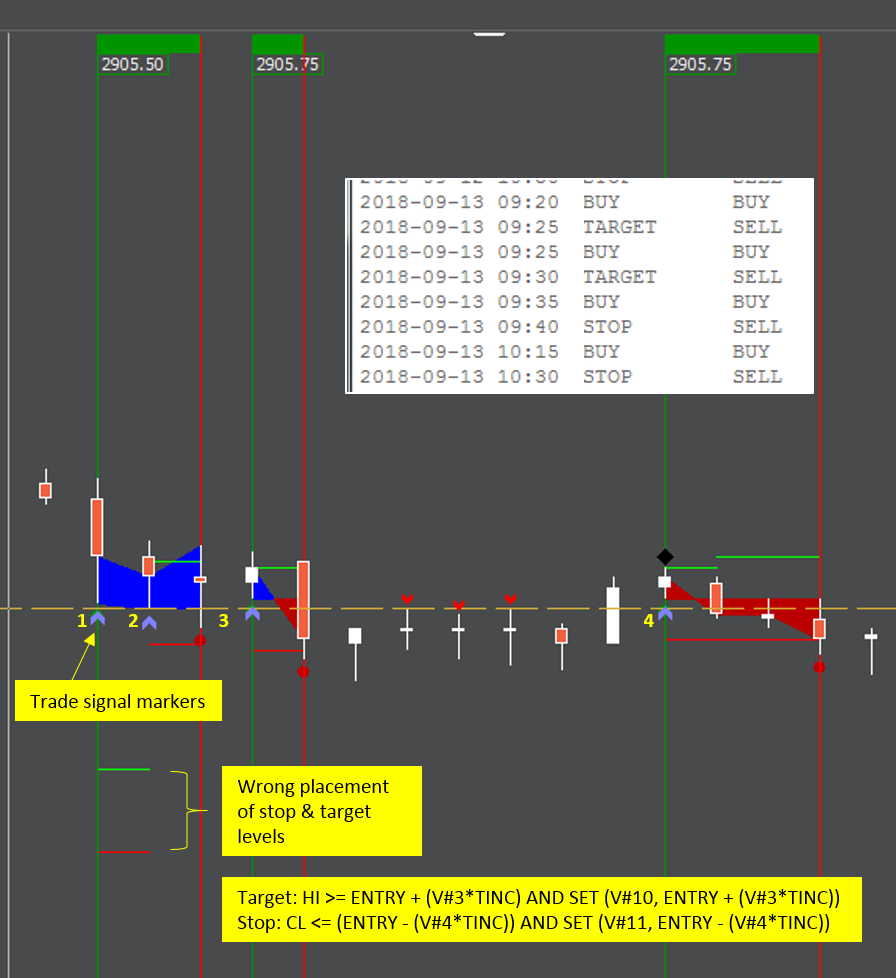
TSYS clearly marks all position changes, whether it be an entry, an exit, a reversal or an addition or reduction of an existing position. Stepped lines are optionally drawn on every bar in every trade, to show the entry price, stop/trailing stop price, target price, and more. An optional trade box can be wrapped around every trade. Since Trading Systems can use multiple signals/rules to manage the behavior of the system over time, this indicator is much more powerful than a single Signal Marker or combination of Signal Markers. The Trading System allows each signal/rule to have knowledge of the current condition of other signals, as well as the current characteristics of the overall system.
TSYS also has an option for "Custom Result". When this option is checked, the indicator will simplify into a single result which can be drawn with any of the standard line or histogram drawing formats. Custom Results include:
- Position Size
- Bars In Position
- Balance
- Entry
- Stop
- Target
- All 512 User Variables (V# Variables)
TSYS gives the user the unique ability to plot User (V#) Variables historically. User Variables, along with the Trading System tokens STOP, ENTRY, and TARGET, are not historical by nature, since each symbol has only one value for any of these variables at any given instant. TSYS captures these values as the system unfolds, and presents the values historically, allowing the user to closely monitor the state of his system at the current time, as well as in the past. TSYS is a "completed bar" indicator. It only recalculates once per bar, and only when that bar is completed. While a bar is in the process of forming, TSYS will not reflect any actions that might have resulted from the processing of that partial bar. Then the bar is completed, TSYS processes it and takes any necessary actions, and displays the results. There are two reasons for using this method. First, it prevents premature signals from firing, and ensures that any signal that triggers and action, is performing on completed data, and is therefore permanent. Secondly, by calculating only once per bar, the processing becomes much more efficient. This can certainly be an issue when using complex trading systems. Along the same lines, before adding TSYS to any chart, make sure the viewing period of the chart is reasonable, as the TSYS will initially compute on all the bars involved in the chart. Initial calculation can become somewhat lengthy on extended viewing periods (last 50 days of 1-minute data).
The Trading System Indictor (TSYS) includes also a custom band option. This option is labeled "Draw Band Between Values 2 and 3" and gives the user the ability to draw a solid or hollow band between ony of the available price values. As a common example, the user might want to draw a band between the system's stop and target values. Combining such a "stop-target" band with a Profit Band (drawn between Entry and current price) results in a nice visual representation of the trading systems state both historically and going forward. This setup also works well when drawn behind an instrument which is in turn drawn as a connected line. The custom band also has a "hollow" option. When "hollow" is checked, the only the borders of the band will be drawn for each bar.
Presentation