Volume Price Statistics requires the Volume Analysis Package.
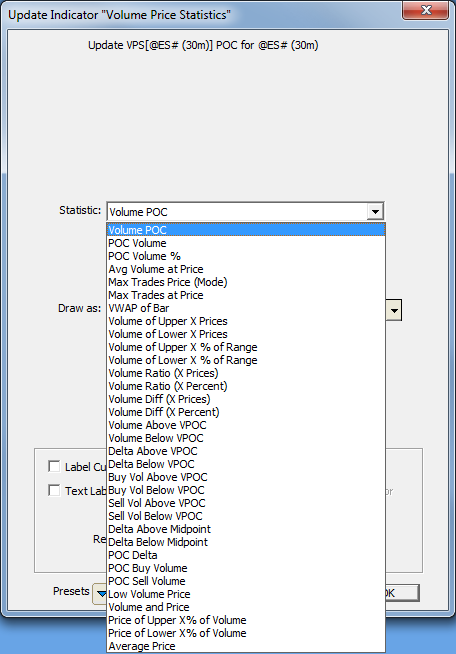
The Volume Price Statistics indicator provides the user with a variety of statistical measures based on the volume at price.
Presentation

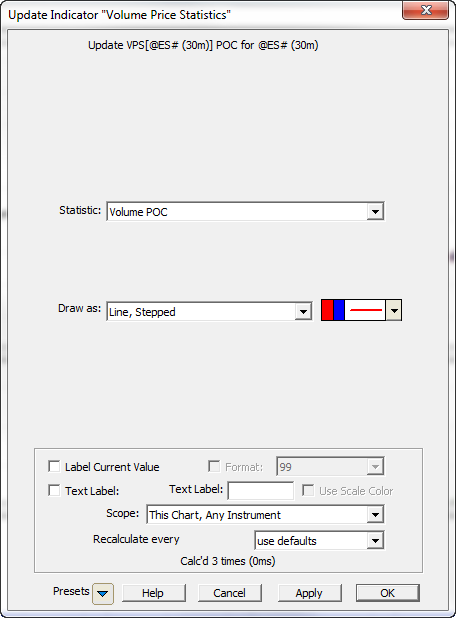
Above is a 30-minute of the S&P Mini Contract (ES #F, eSignal). The VPS indicator is plotted twice in the chart. In the upper pane, it's showing the Volume POC as a red stepped line. In the lower pane, it's showing the POC Volume as a histogram.