Historical Volatility
Historical Volatility reflects how far an instruments price has deviated from it's average price(mean) in the past. On a yearly basis, this number represents the one standard deviation % price change expected in the year ahead. In other words if a stock is trading at 100 and has a volatility of 0.20(20%) then there is a 68% probability(1 standard dev = 68% probability) that the price will be in the range 80 to 120 a year from now. Similarly there is a 95% probability that the price will be between 60 and 140 a year from now (2 standard deviations). The higher the volatility number the higher the volatility. Within Investor/RT, there are two methods to choose from when computing volatility: The Close-to-Close Method and the Extreme Value Method. The Close-to-Close Method compares the closing price with the closing price of the previous period, while the Extreme Value Method compare the highs and lows of each period. The method used, along with the number of periods used in the calculation, and the periodicity(duration of each period) may be set by the user in the Options Analysis Preferences.
Theoretical Value
The Theoretical Value of an option is expressed without the influences of the market, such as supply/demand, current volume traded, or expectations. It is calculated using a formula involving strike price, exercise price, time until expiration, and historical volatility. Currently, Investor/RT uses the Black/Scholes model to calculate the theoretical value of the option, although other model options may be added in the future.
Implied Volatility
Implied Volatility is calculated by inspecting the current option premium, and determining what the volatility should be in order to justify that premium. It is determined by plugging the actual option price into our Theoretical Value model and solving for volatility. This implied volatility can be compared to the historical volatility of the underlying in search of underpriced and overpriced options.
Options Delta
Options Delta is the rate of change of the theoretical value of an option with respect to its underlying. It is also defined as the probability that an option will finish in the money. Higher deltas (approaching 1.0) represent deep in-the-money options, and lower deltas (approaching 0.0) represent further out-of-the-money options. At-the-money options generally have deltas around 0.50, representing a 50% chance the contract will be in the money. This also represents the fact that if the underlying moves 1.0 point, the options should move 0.50.
Options Gamma
Gamma represents the rate of change of an options Delta. If an options has a delta of 0.35 and a gamma of 0.05, then the option can be expected to have a delta of 0.40 if the underlying goes up one point, and a delta of 0.30 if the underlying goes down one point.
Options Theta
Theta is also commonly referred to as time decay. It represents the options loss in theoretical value for each day the underlying price remains unchanged. An option with a theta of 0.10 would lose 10 cents each day provided the underlying does not move.
Options Vega
Vega is the sensitivity of an options price to a change in volatility. An option with a vega of 0.25 would gain 25 cents for each percentage point increase in volatility.
Options Lambda
Lambda measures the percentage change in an option for a one percent change in the price of the underlying. A Lambda of 5 means a 1 percent change in the underlying will result in a 5 percent change in the option.
Options Rho
Rho measures the sensitivity of an option's theoretical value to a change in interest rates.
The following steps will guide you through the process of setting up a quotepage to calculate and monitor these Option Analysis values:
- Implied Volatility
- Historical Volatility
- Theoretical Value
- Delta
- Gamma
- Theta
- Vega
- Rho
- Lambda
-
Setup a new quotepage format that will be used for options quotepages.
 Go to Setup:Preferences, choose "Format Definition", and click "OK". Select "New Format" for the format name. Add the following Data Items(in the order shown below) to the right list box. Ticker Symbol, Name, Theoretical Value, Last, Implied Volatility, Volatility, Delta, Gamma, Theta, Vega, Rho, Lambda,Days to Expiration Choose "Save As", and type in the name "Options Format" and click "Save". Close the "Setup Formats" window.
 -
Go to Setup:Preferences and choose "Option Analysis Preferences".
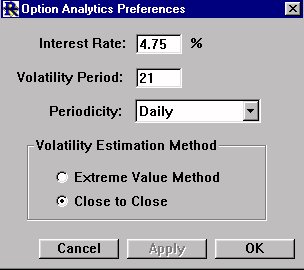
Fill in the risk free interest rate(e.g. 4.75). For Volatility Period, enter the number of periods to use when calculating the volatility of the underlying equity instrument. The default value is 21 periods. For Periodicity, choose whether you would like to calculate volatility using Daily, Weekly, or Monthly data. Finally, choose which method to use when calculating volatility. The Extreme Value Method compares highs and lows for each period, while the Close to Close Method compares closes on consecutive periods. Click "OK" to close the window.
-
The next step is to create a new Quotepage for the options we want to analyse. Click on the QP
 button in the main toolbar, and choose "New". Close the "Add to QuotePage" window that appears, as we will be adding options using a different method. Click on the "Change Format"
  button in the quotepage toolbar, and choose "Options Format". The quotepage should now be formatted properly for options. Leave the empty quotepage open.
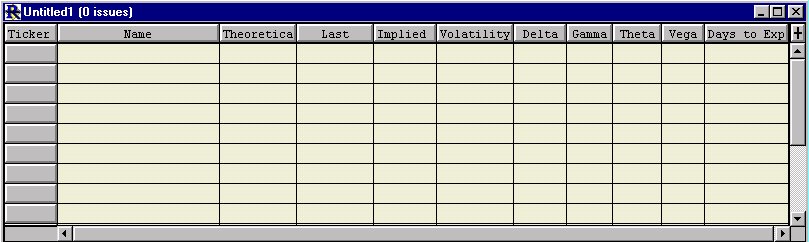
-
In order for the Options Analysis values to be calculated correctly, ensure that you have enough valid historical data for the underlying instrument. You may add IBM to the options quotepage by clicking the "Insert a Row"
 button on the quotepage toolbar. Type in "IBM" and press "Return". You can now double click on the IBM ticker symbol to view a chart on IBM. If you chose to calculate volatility based on 21 periods of daily data, then ensure you have 21 periods of valid data on IBM in your chart. If not, Investor/RT will have difficulty calculating the "greeks" values because they are all based on the volatility calculation. You must be set up to receive options data from your data service, and your data feed must be active. As quotes are received for each option, the analysis values will be calculated and updated in the quotepage. The resulting quotepage should resemble this:

Investor/RT can calculate the historical volatility of stock instruments and in turn can evaluate associated stock options to determine their theoretical value, implied volatility, and greeks. This preference window is the place where you specify the parameters for Investor/RT to use when calculating the historical volatility for stocks. The calculation is normally performed using 21 bars of daily historical data. The calculation is also based on the no-risk prevailing interest rate expressed in percent per year. Two methods for volatility calculation are supported--the extreme value method and the close to close method.