Duration:11:33
Variable speed version:
Watch
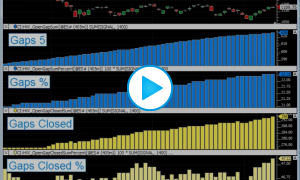
What is the maximum distance that price moves from the open of the day session each day? What is the average max move? What is the median max move? How often does price open in previous days range? When opening opening in range, how often does it touch both the previous days high and low? How often does it touch neither?
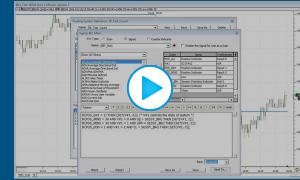
Opening Statistics Chart Definition
These statistics are based on 1,200 day period of ES data ending 02/06/2011
- Average Move from Open: 14.71
- Median Move from Open: 11.50 (Mode: 7.00)
- Price Opened in Range 768 of 1200 days (64%)
- When opening in range, price touched both the previous high and low 77 of 768 times (10%)
- When opening in range, price touched neither previous high or low (stayed within previous days range) 124 of 768 times (16.14%)
- When opening in range, price touches either the previous high or the previous low (but not both), 73.86% of time.