Duration:10:49
Variable speed version:
Watch
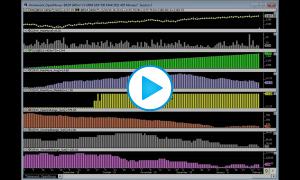
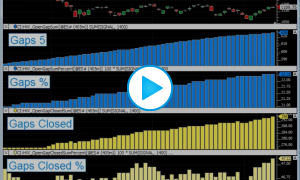
This video describes how to flexibly produce statistical results using Trading System Tools. This method can be especially beneficial when several events are required to occur sequentially within a day or session. In this specific example, we look fro price to trade above the Initial Balance High (IBH), then retest then IBH. We then count the number of times these events occurred and priced closed above the IBH or below the IBH. The definition for the Trading System featured in the video can be downloaded below.
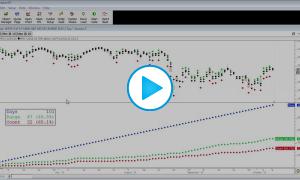
1895 days were tested.
1127 days price moved above IBH and then came back to test IBH
Of those 1127 days, 617 closed above the IBH (54.7%) and 510 closed below IBH (45.3%)