Duration:54:17
Variable speed version:
Watch
This video takes a comprehensive look at the powerful Volume Breakdown Indicator.
Video timeline
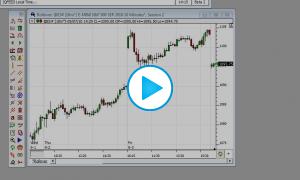
- Introduction and Overview - What this video will be working towards, including images of the charts we will create during video.
- What is Delta? - How is Delta Computed
- Tick Data - Volume Breakdown requires tick data. Where's my tick data?
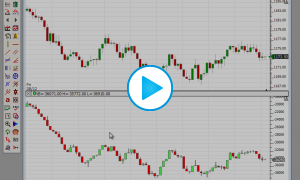
- Cumulative Delta Bars - The most common implementation of the Volume Breakdown Indicator. More
- Filtering Size - How to configure Volume Breakdown to consider only larger trades.
- Smart Compression - How smart compression can effect certain results of the Volume Breakdown Indicator. More
- Other Implementations - Other common implementations of the Volume Breakdown Indicator.
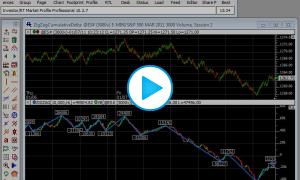
- Indicators on VB - Applying indicators and statistics to the Volume Breakdown results, including Zig Zags, Signal Markers, Trendlines, and any other indicator available in Investor/RT. Zig Zag of Cum Delta Trendlines on Cum Delta RTL Language
- Effective Volume - Building cumulative delta from 1-minute data.
- Miscellaneous - Review of several lesser used options of the Volume Breakdown Indicator: Normalize, Trades, Up Tick vs Down Tick, storing current value in User Variables. User Variables
Additional Notes
The Volume Breakdown Indicator requires the Volume Analysis Package. Adding VAP is easy. Simply login and click on your subscriptions tab to manage your subscription.
Volume Breakdown Indicator data can be easily exported to a text file which is formatted nicely for Excel. Right-click on the Volume Breakdown indicator in the chart and choose "Export Data".