 |
Homework #28: Open Outside Range Statistics cpayne [totalcount]
7 years 4 months ago
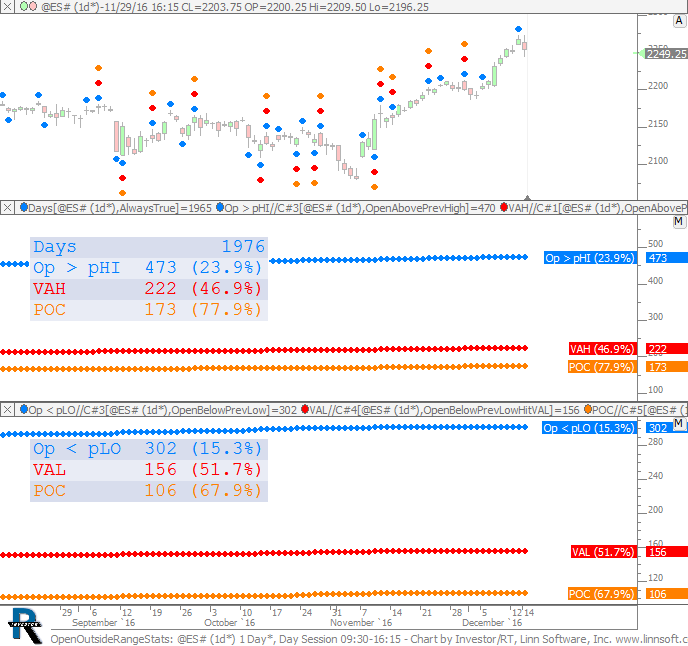
Statistic on days that opened outside of previous day range. If opening above range... How often did price return to the VAH? How often did price return to POC? If opening below range... |
View |
 |
VolumeScopeExtendKeyPrices (@ES#) cpayne [totalcount]
6 years 2 months ago
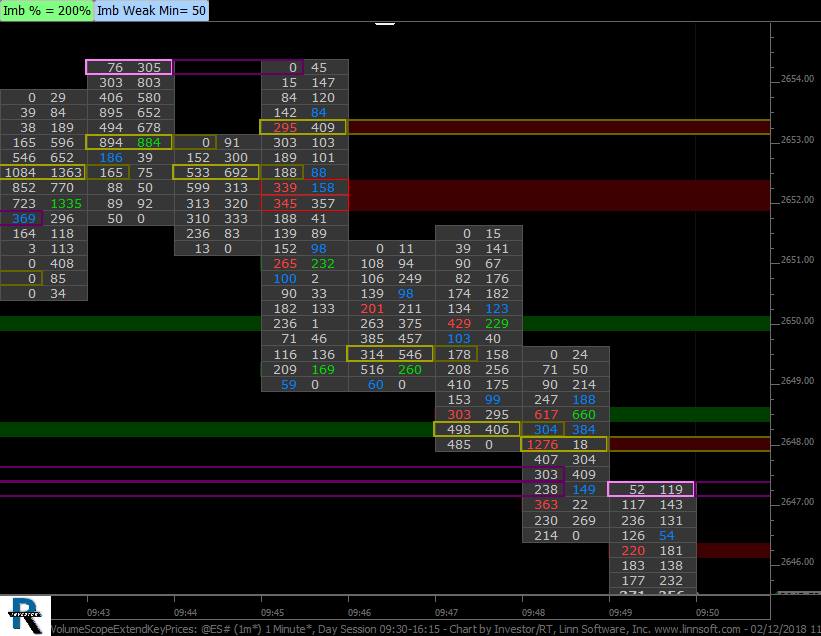
Chart uses Multiple Price Highlighter to extend key prices while naked. Prices extended include VPOC (gold), Buy Imbalance (green), Sell Imbalance (red) and Unfinished Business (pink). |
View |
 |
OpeningSwingZZO (@ES#) cpayne [totalcount]
6 years 4 months ago
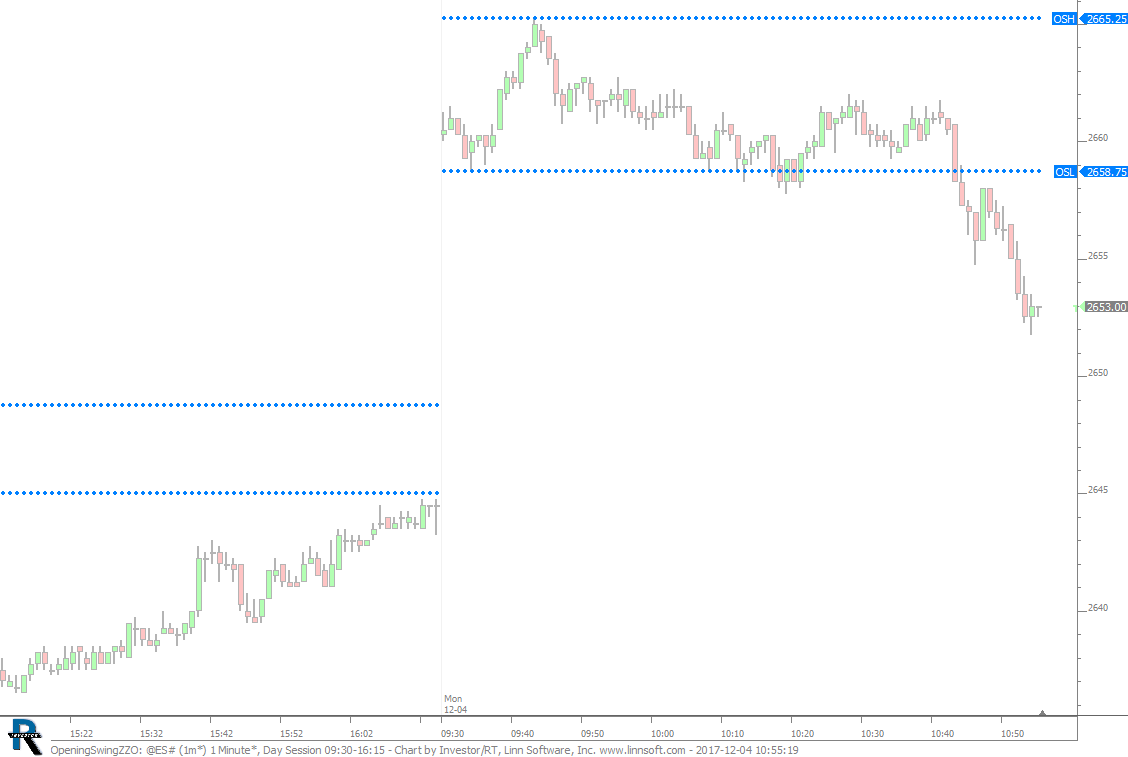
Open Swing High and Low Automated. This chart was uploaded by Investor/RT 13.1.1 showing symbol: @ES#. |
View |
 |
VolumeFilterLeveling (@ES#) cpayne [totalcount]
6 years 5 months ago
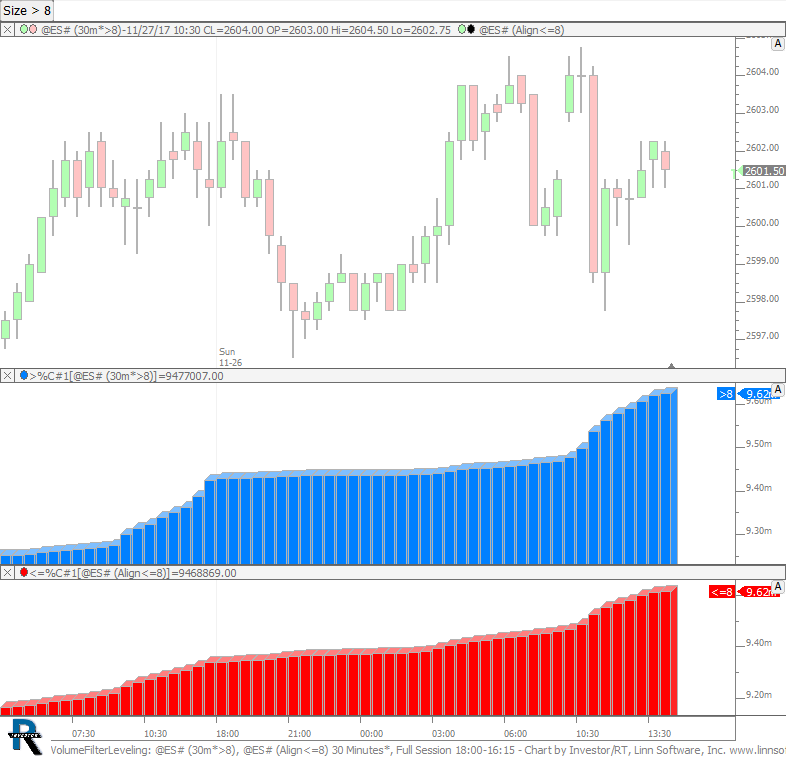
Volume Size Selection for Equal Distribution of Volume. This chart was uploaded by Investor/RT 13.1.1 showing symbol: @ES#. |
View |
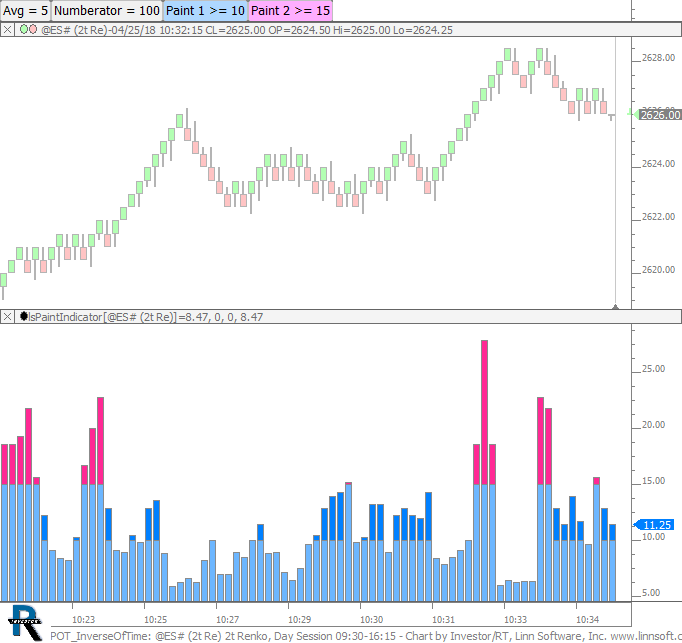 |
POT InverseOfTime (@ES#) cpayne [totalcount]
6 years 3 days ago
Pace of Tape - Lower Pane computes an inverse of the time it takes to complete each bar. A smoothing of time is used for that denominator with the smoothing period specified with button. |
View |
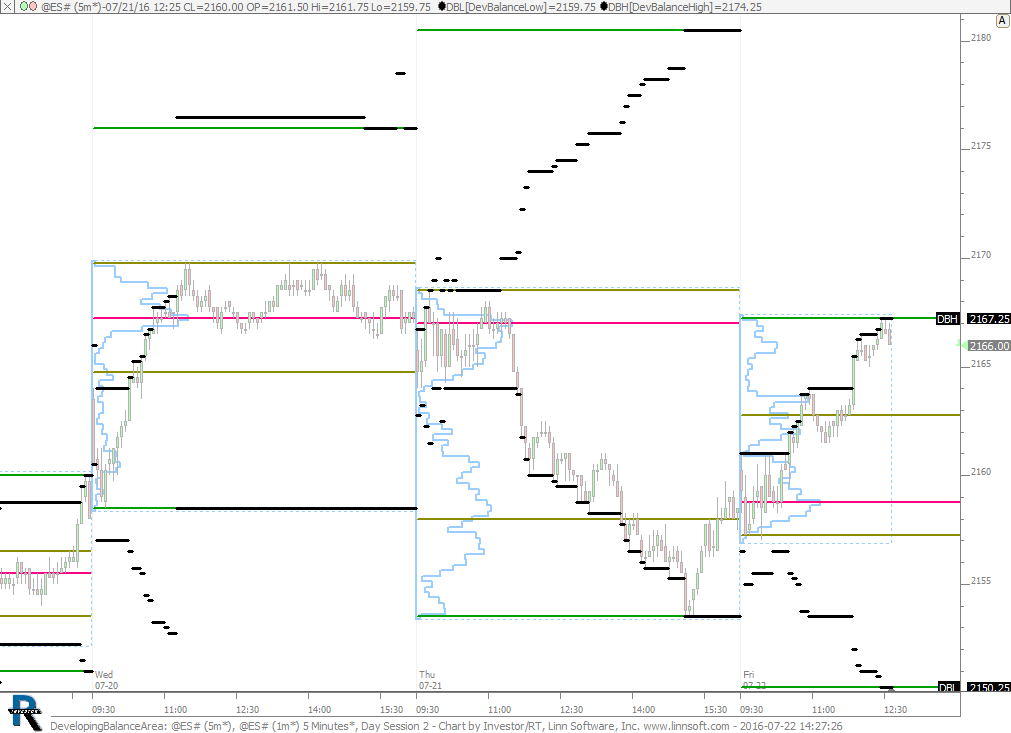 |
DevelopingBalanceArea (@ES#) cpayne [totalcount]
7 years 9 months ago
Developing Balance Area. This chart was uploaded by Investor/RT 12.6.1 showing symbol: @ES#. |
View |
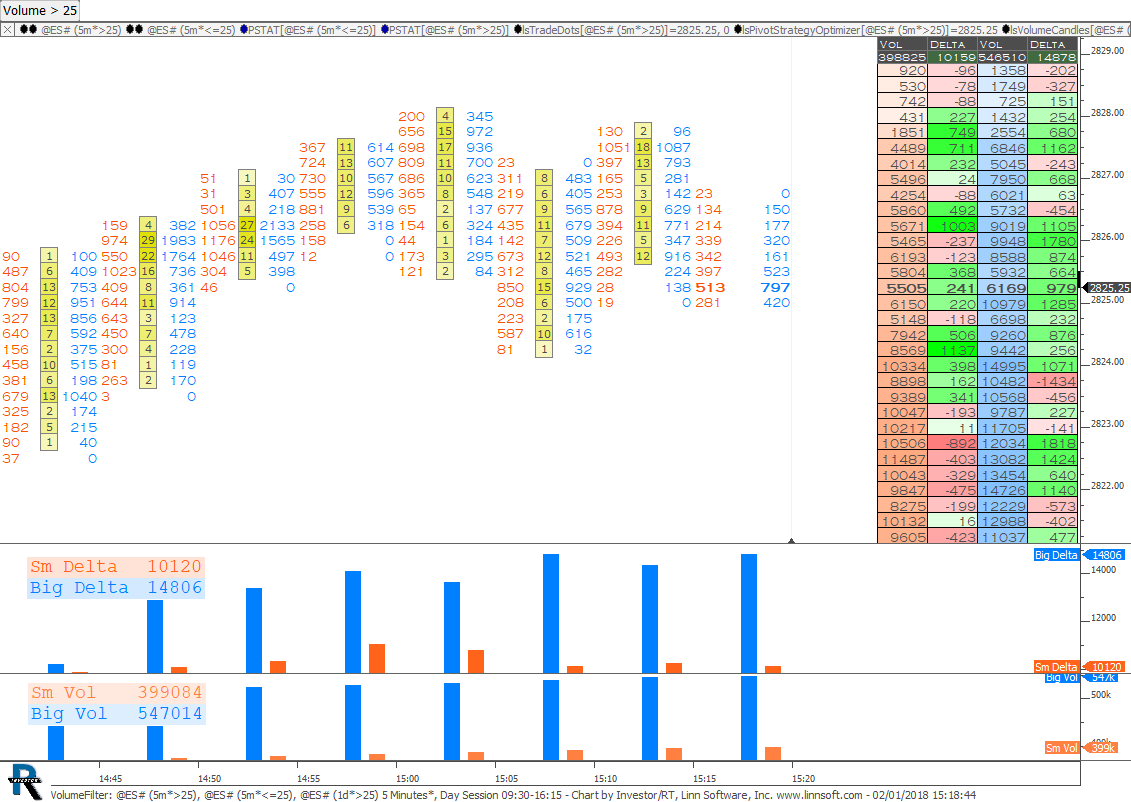 |
VolumeFilter (@ES#) cpayne [totalcount]
6 years 2 months ago
Volume Filtering with Volume Candles, Trade Dots, Profile Indicator, and Volume Breakdown. |
View |
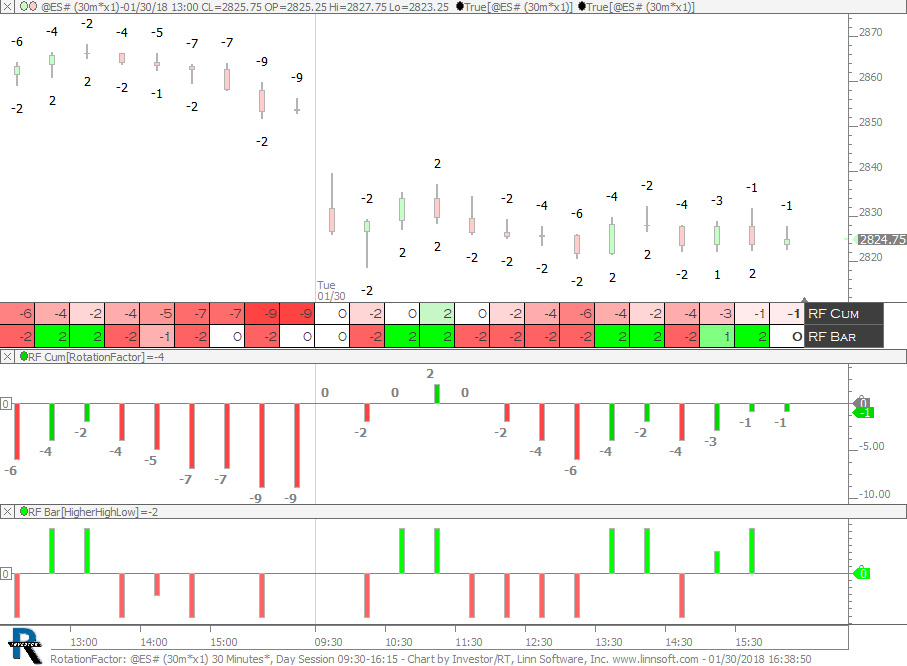 |
RotationFactor (@ES#) cpayne [totalcount]
6 years 2 months ago
Rotation Factor as Text - Per Bar and Cumulative for Session. This chart was uploaded by Investor/RT 13.2.2 showing symbol: @ES#. |
View |
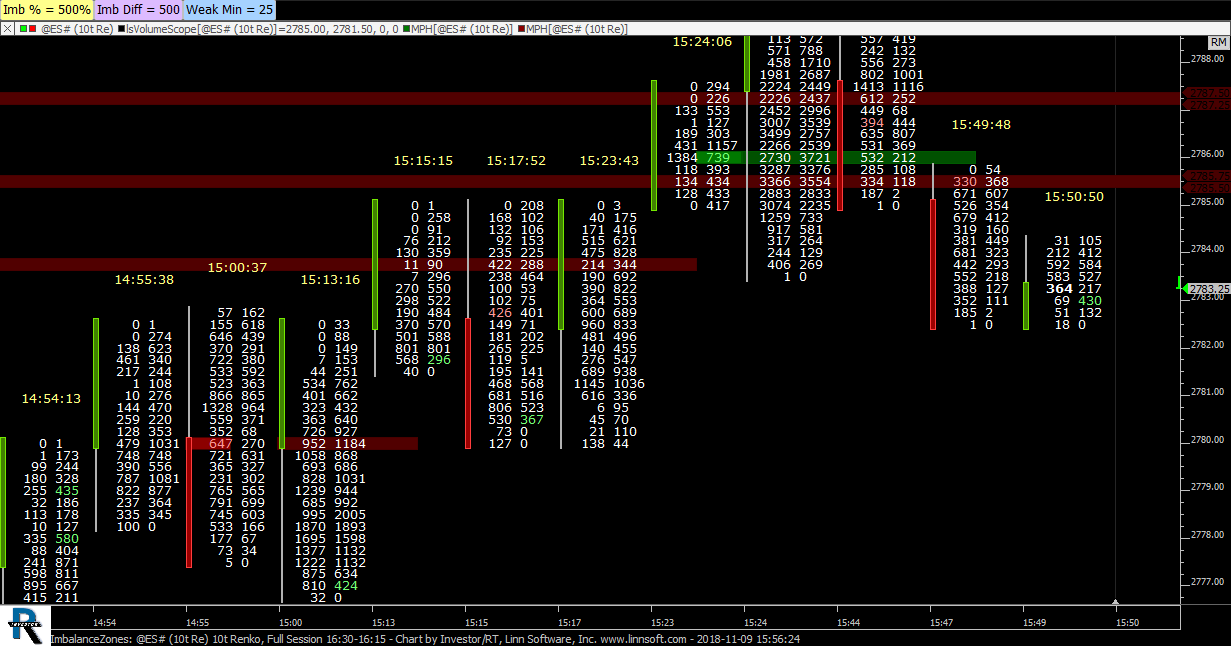 |
ImbalanceZones (@ES#) cpayne [totalcount]
5 years 5 months ago
Imbalance Zones. This chart was uploaded by Investor/RT 13.3.5 showing symbol: @ES#. |
View |
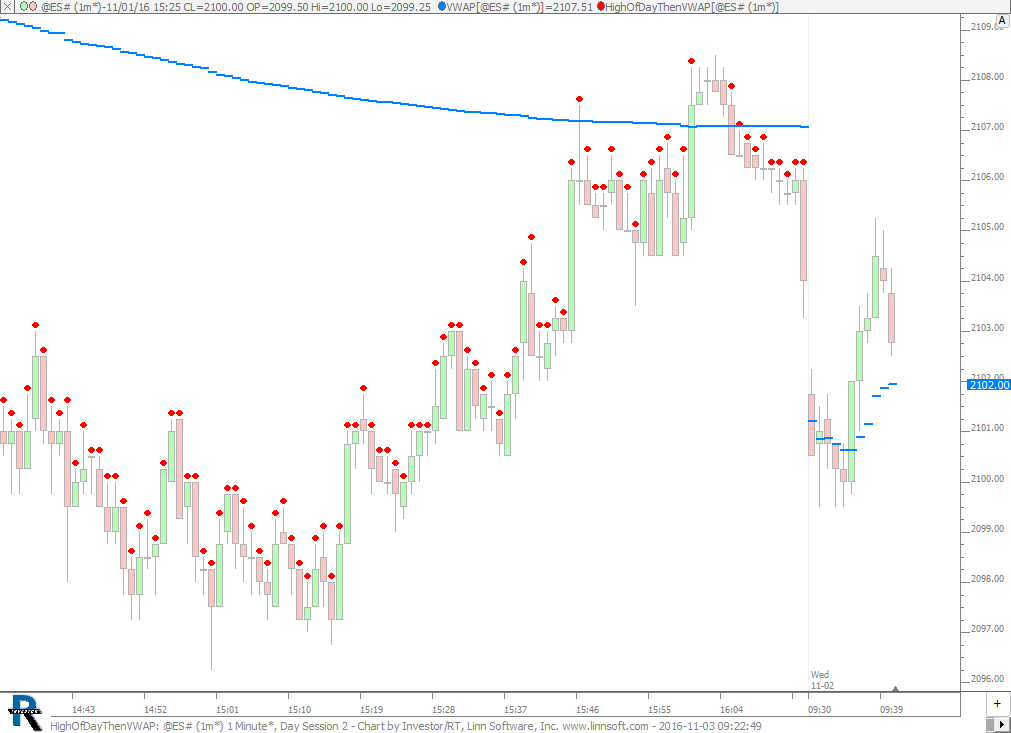 |
HighOfDayThenVWAP (@ES#) cpayne [totalcount]
7 years 5 months ago
High Of Day Then VWAP. This chart was uploaded by Investor/RT 12.6.7 showing symbol: @ES#. |
View |
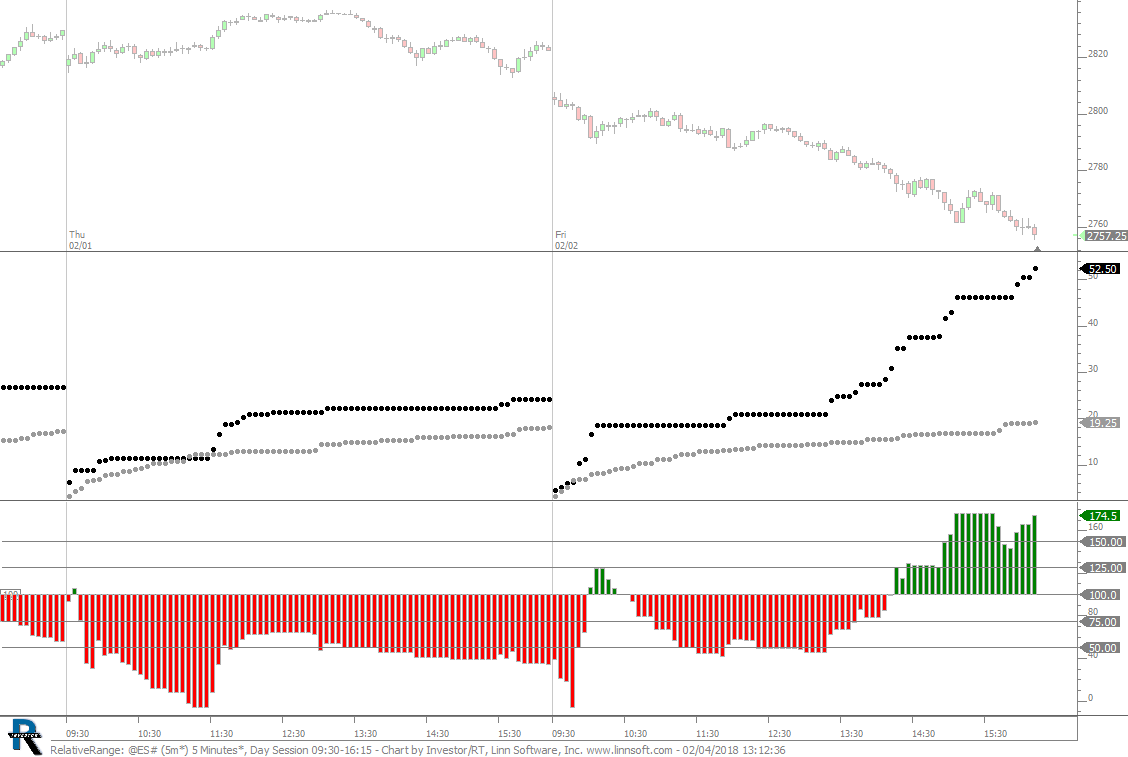 |
RelativeRange (@ES#) cpayne [totalcount]
6 years 2 months ago
Relative Session Range. This chart was uploaded by Investor/RT 12.6.1 showing symbol: @ES#. |
View |
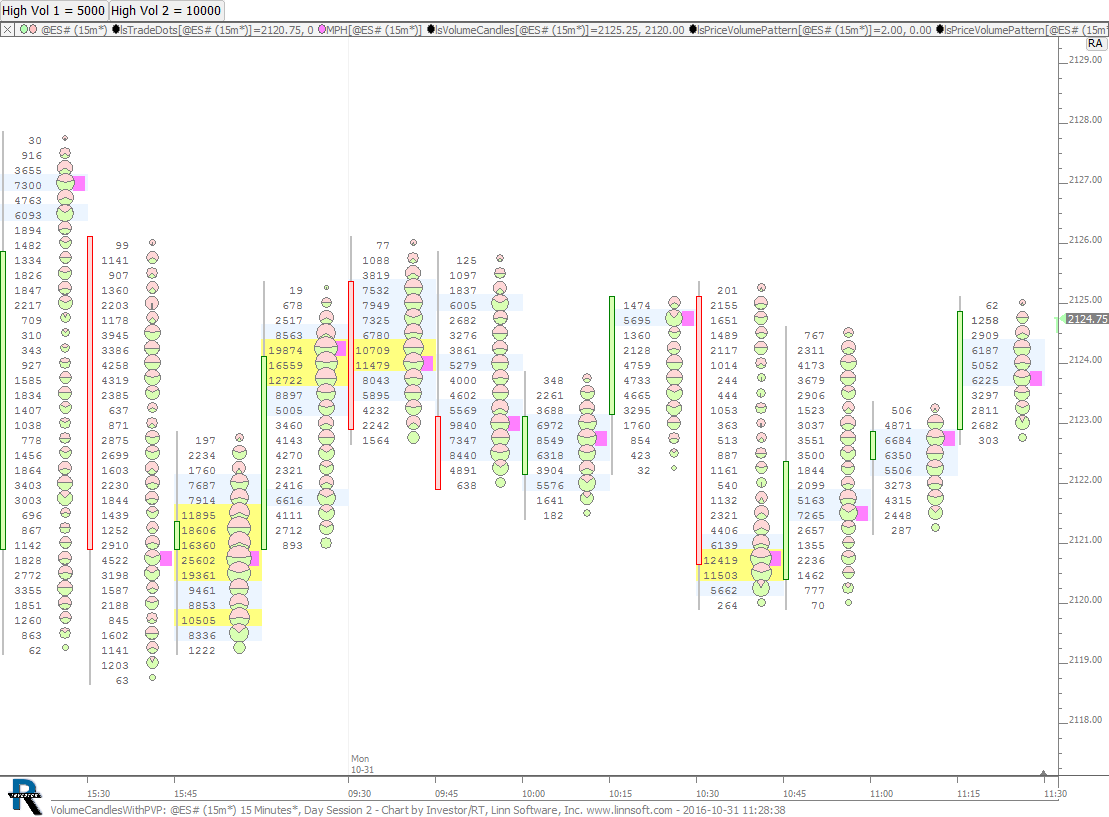 |
VolumeCandlesWithPVP (@ES#) 2 cpayne [totalcount]
7 years 5 months ago
Volume Candles with Trade Dots, PVP, and MPH. Use the buttons at top to adjust the high volume at price filters (blue and yellow highlighting). |
View |
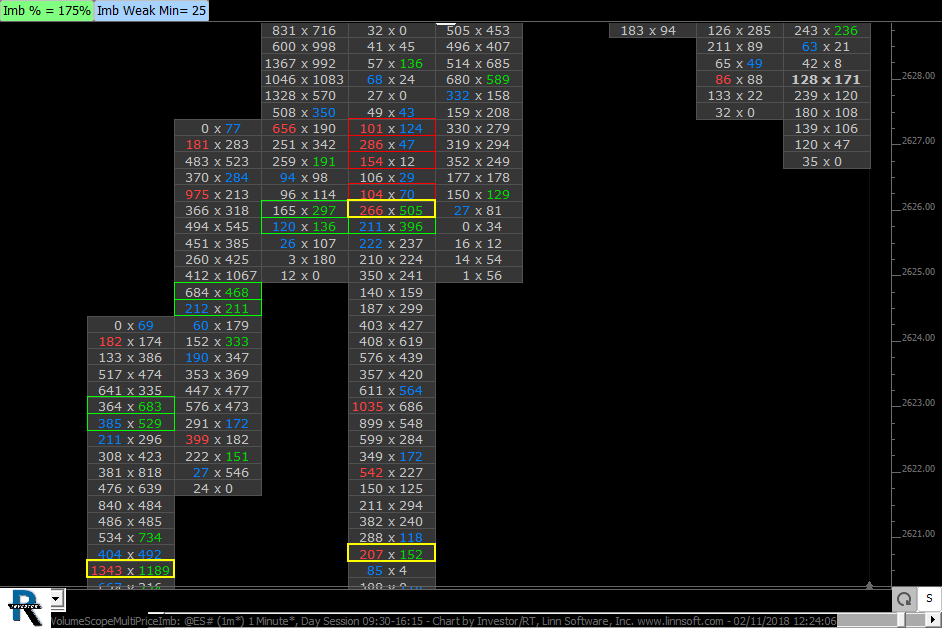 |
VolumeScopeMultiPriceImb (@ES#) cpayne [totalcount]
6 years 2 months ago
PVP Identifies multi-price imblance with red and green boxex around prices. This chart was uploaded by Investor/RT 13.2.2 showing symbol: @ES#. |
View |
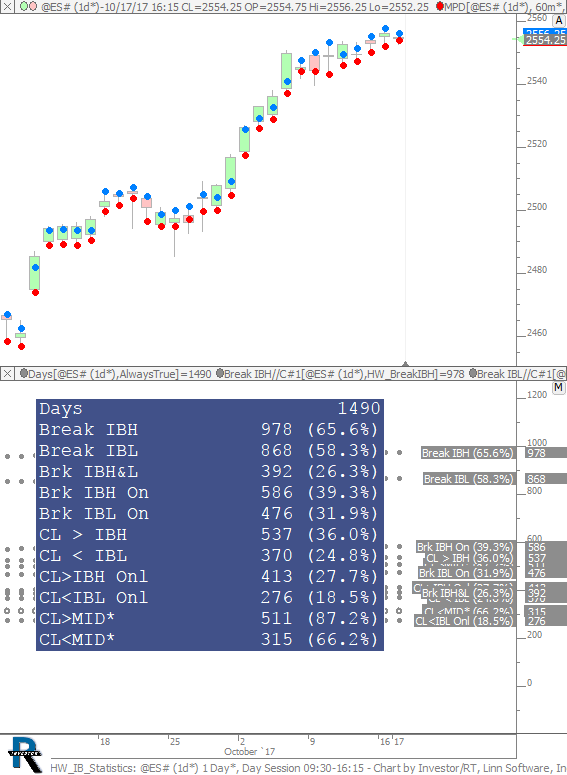 |
HW IB Statistics (@ES#) cpayne [totalcount]
6 years 6 months ago
IB and Mid Break and Close Statistics. This chart was uploaded by Investor/RT 13.1.1 showing symbol: @ES#. |
View |
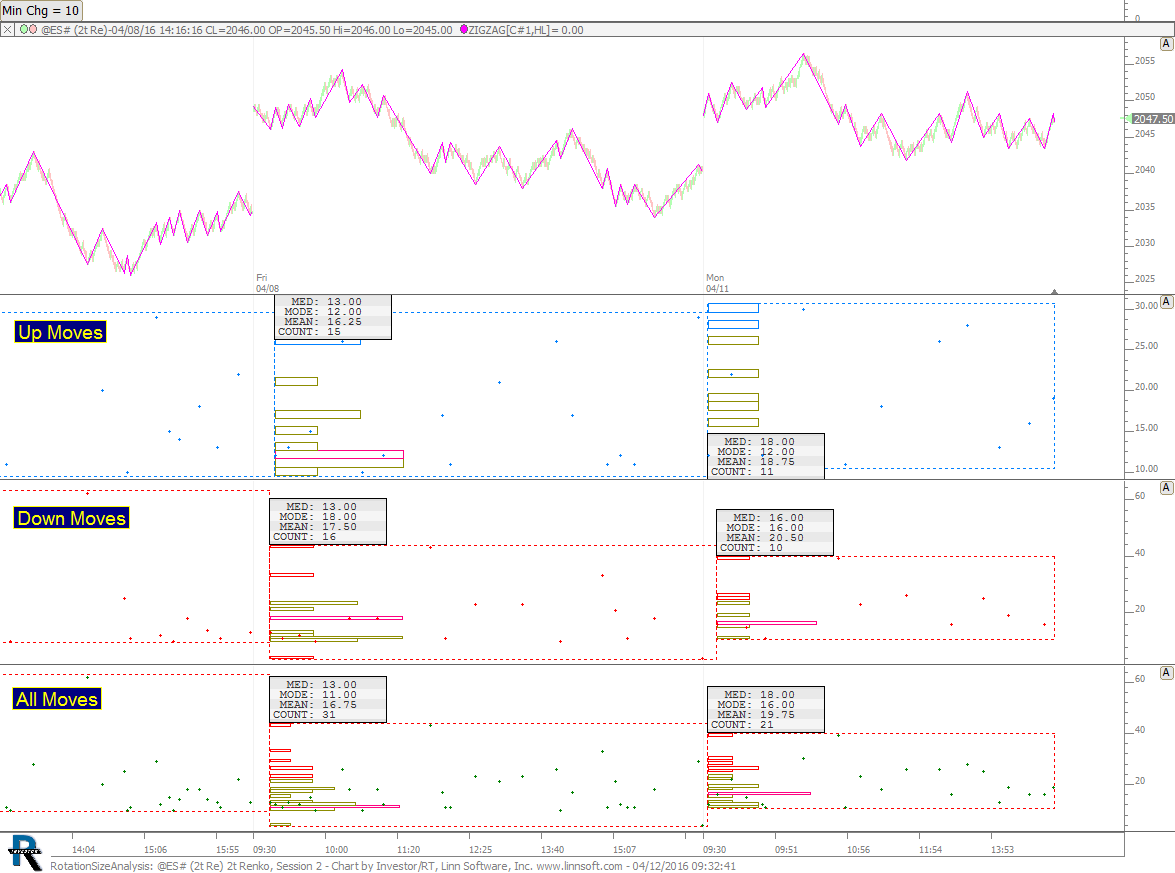 |
RotationSizeAnalysis (@ES#) 3 cpayne [totalcount]
8 years 2 weeks ago
Rotation Size Analysis: Up Moves, Down Moves, All Moves. Use button at top to adjust min size of moves in ticks. |
View |
 |
BigTradeAlerts (@ES#) cpayne [totalcount]
8 years 1 month ago
Big Trade Alerts: Sounds an alert whenever a trade occurs above a given size, controlled by buttons at top. |
View |
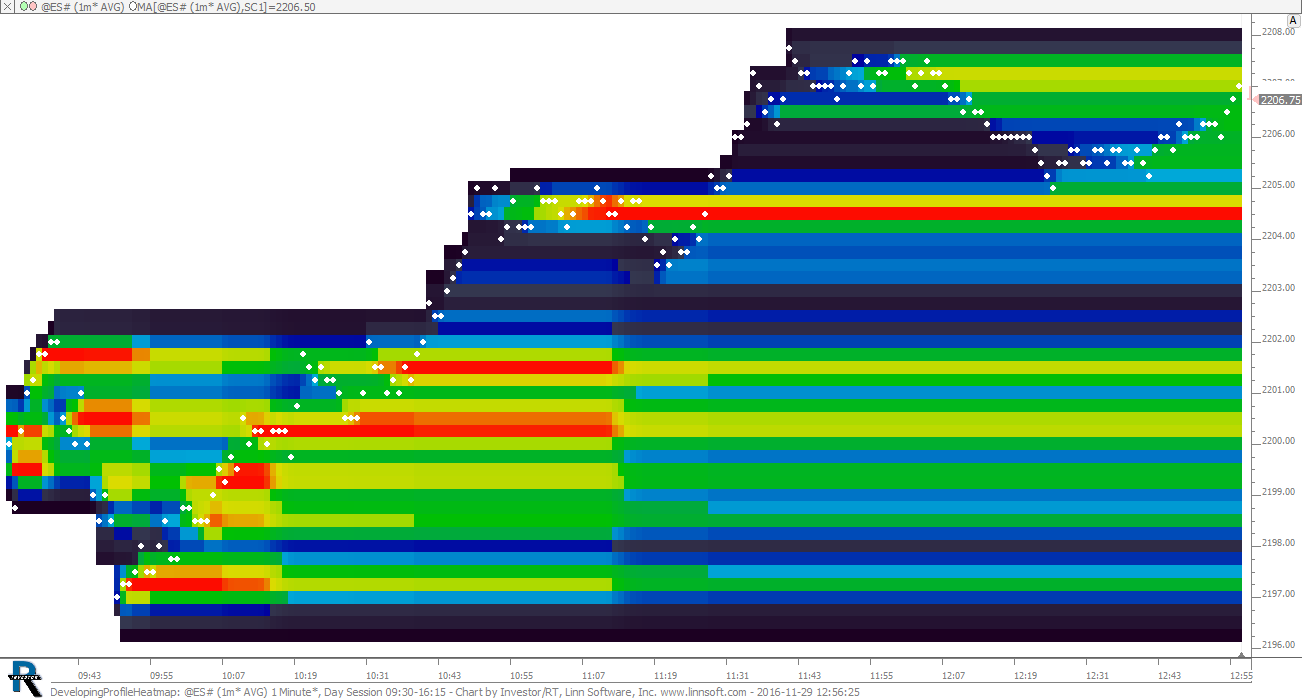 |
DevelopingProfileHeatmap (@ES#) cpayne [totalcount]
7 years 5 months ago
Developing Profile with Heatmap. This chart was uploaded by Investor/RT 12.7.1 showing symbol: @ES#. |
View |
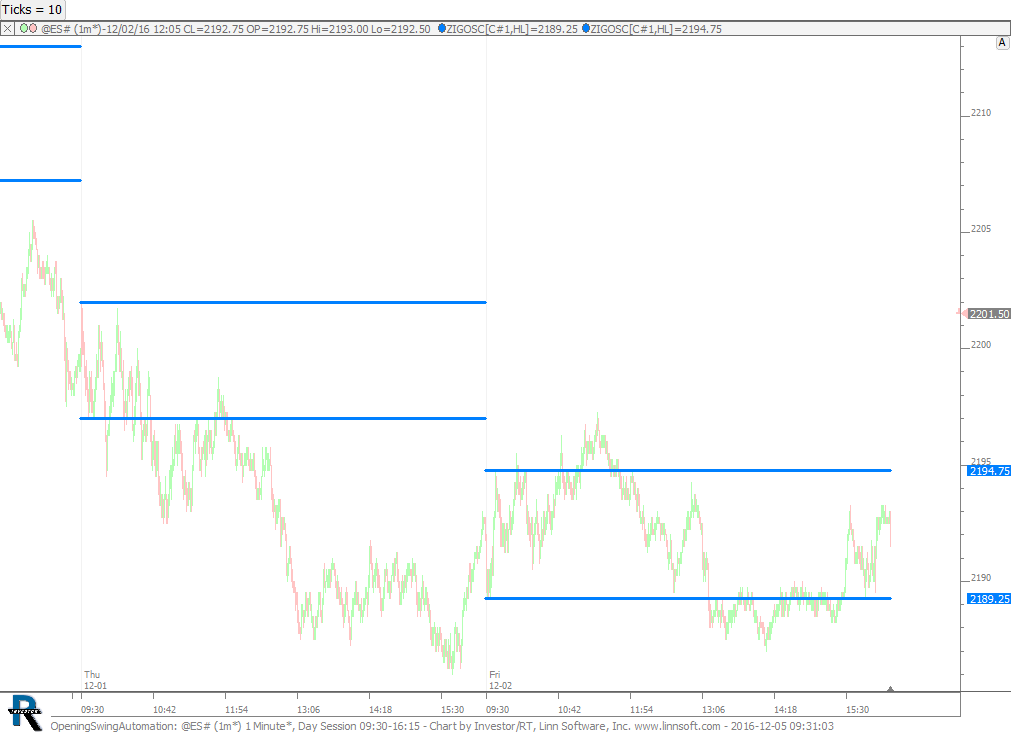 |
OpeningSwingAutomation (@ES#) cpayne [totalcount]
7 years 4 months ago
Opening Swing Automation. This chart was uploaded by Investor/RT 12.7.1 showing symbol: @ES#. |
View |
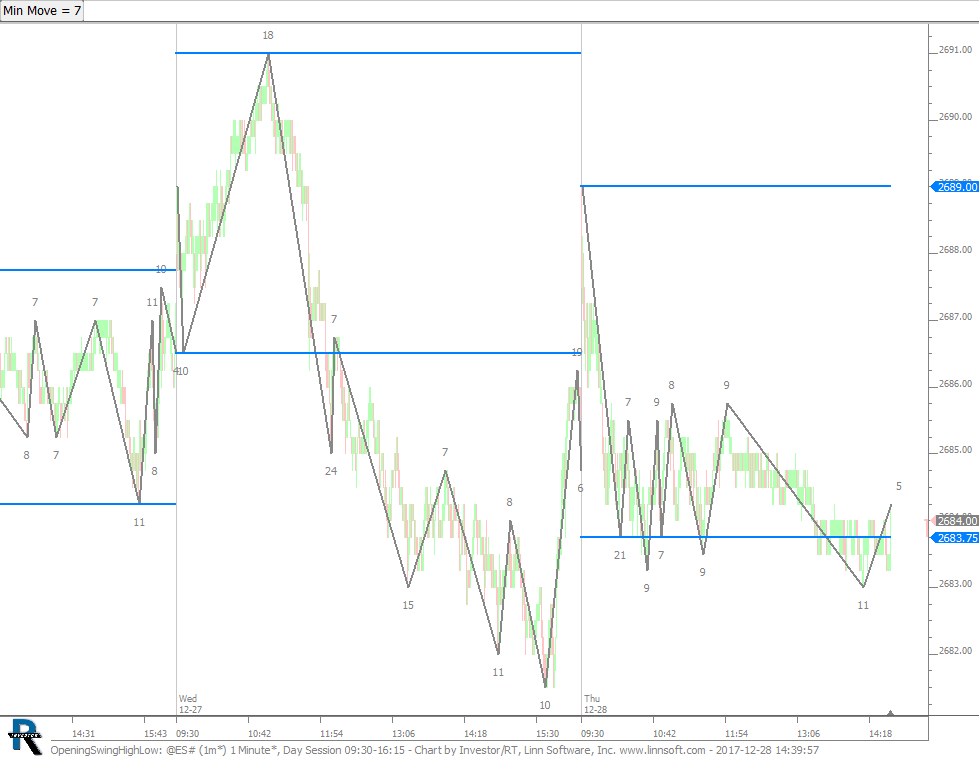 |
OpeningSwingHighLow (@ES#) cpayne [totalcount]
6 years 4 months ago
Opening Swing High and Low. This chart was uploaded by Investor/RT 13.1.4 showing symbol: @ES#. |
View |
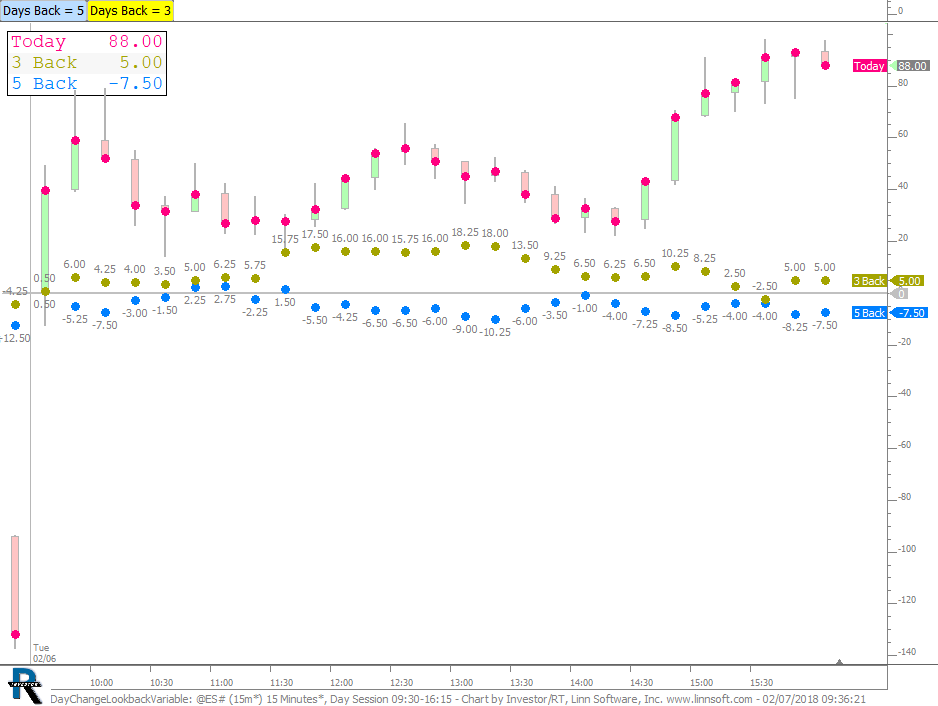 |
DayChangeLookbackVariable (@ES#) cpayne [totalcount]
6 years 2 months ago
Day Change Lookback - Compare today's Day Change price movement from open with that of any past days. Use the buttons at top to control the number of days back (2 overlays). |
View |
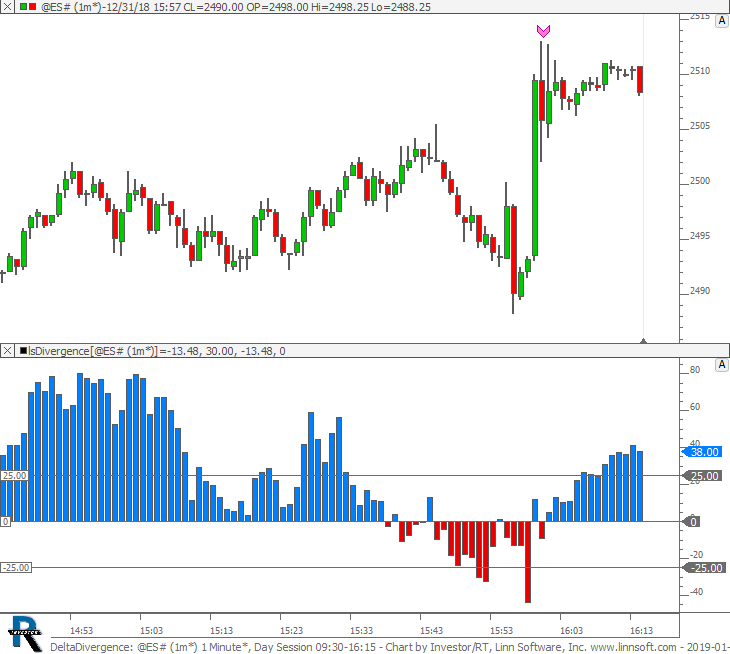 |
DeltaDivergence (@ES#) cpayne [totalcount]
5 years 3 months ago
Delta Divergence. This chart was uploaded by Investor/RT 12.5.9 showing symbol: @ES#. |
View |
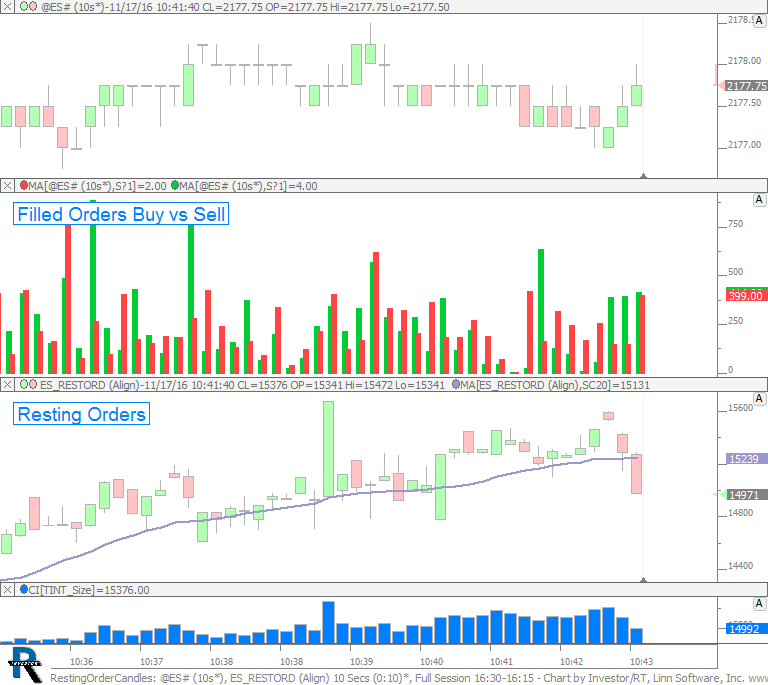 |
RestingOrderCandles (@ES#) cpayne [totalcount]
7 years 5 months ago
Resting Order Candles. This chart is explained in the video Resting Order Candles. |
View |
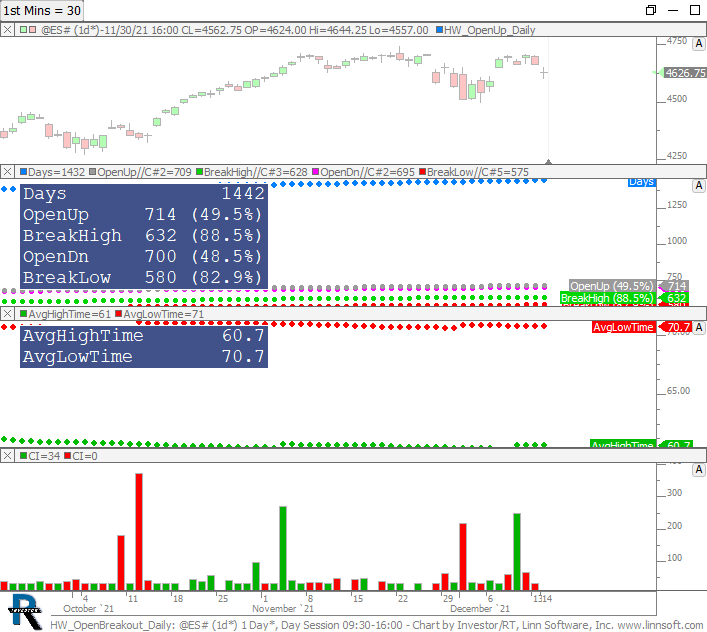 |
HW OpenBreakout Daily (@ES#) cpayne [totalcount]
2 years 4 months ago
Homework - Open Period Breakout Statistics. This chart was uploaded by Investor/RT 12.7.1 showing symbol: @ES#. |
View |
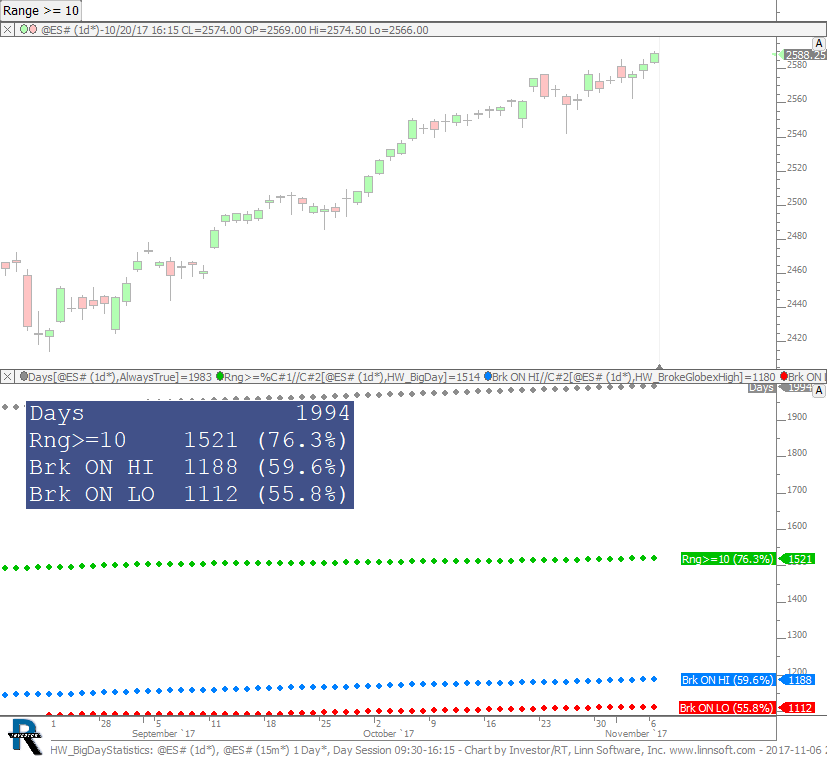 |
HW BigDayStatistics (@ES#) cpayne [totalcount]
6 years 5 months ago
Homework. Number of Big Days (Use Button For Min Range), and Number of Days we break overnight high and low (with percentages). |
View |
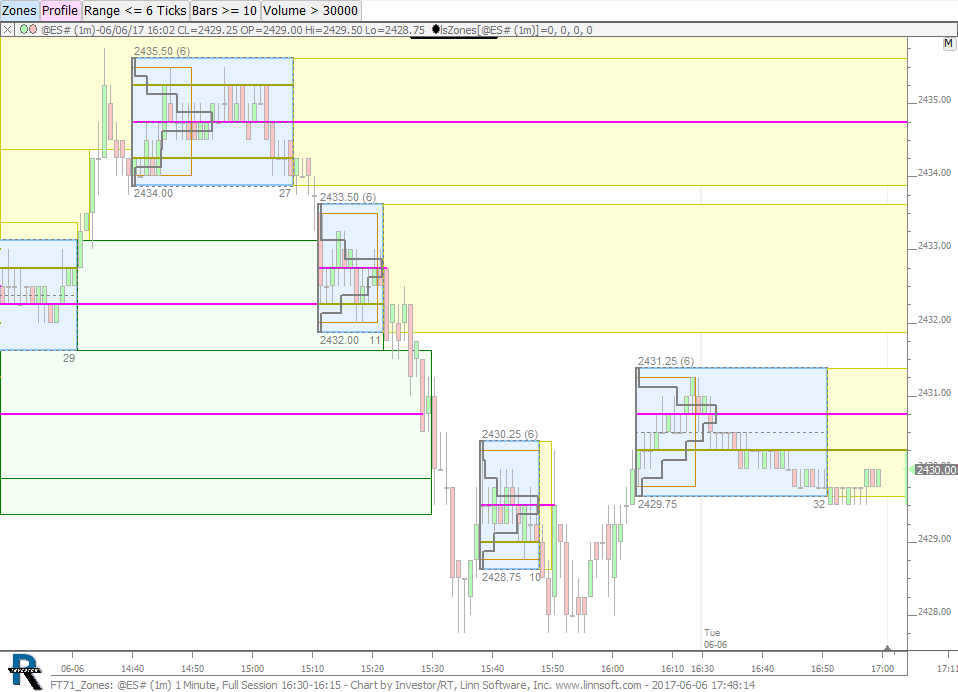 |
FT71 Zones (@ES#) cpayne [totalcount]
6 years 10 months ago
Zones chart used in FuturesTrader71 Webinar on June 6, 2017. This chart was uploaded by Investor/RT 12.7.5 showing symbol: @ES#. |
View |