 |
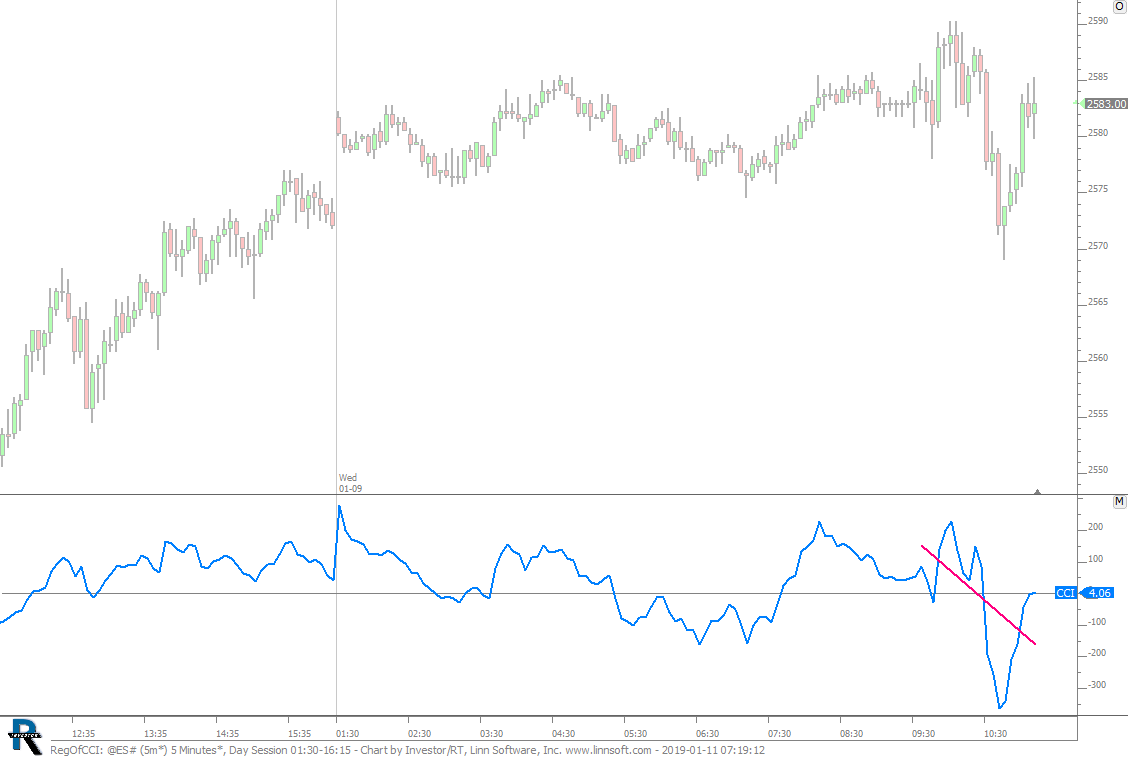
RegOfCCI (@ES#) cpayne [totalcount]
5 years 4 months ago
This chart was uploaded by Investor/RT 13.5.14 showing symbol: @ES#. |
View |
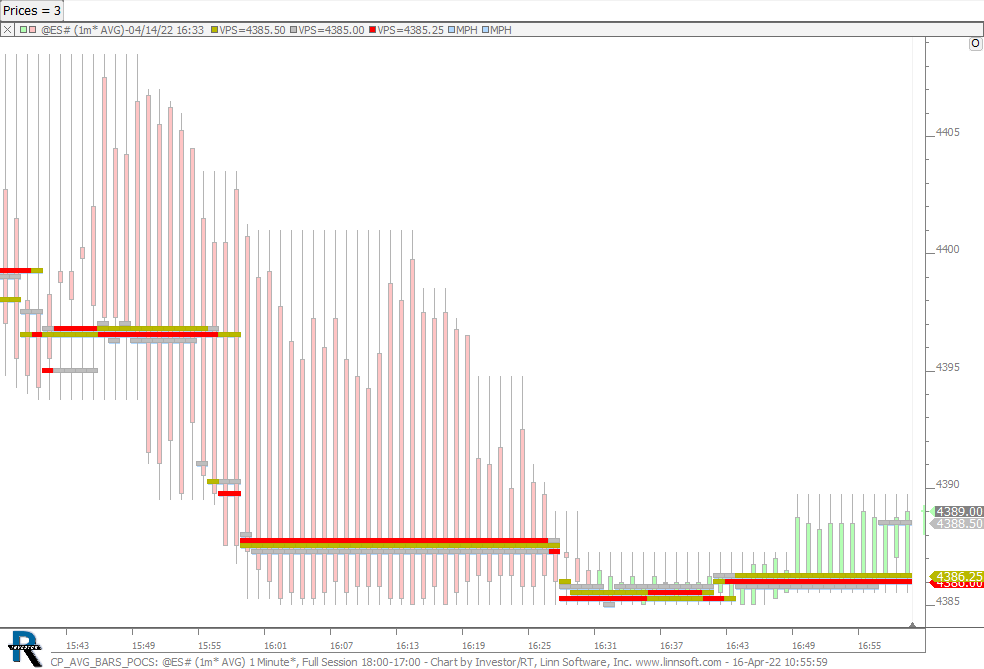 |
CP AVG BARS POCS (@ES#) cpayne [totalcount]
2 years 1 month ago
This chart was uploaded by Investor/RT 15.1.6 showing symbol: @ES#. |
View |
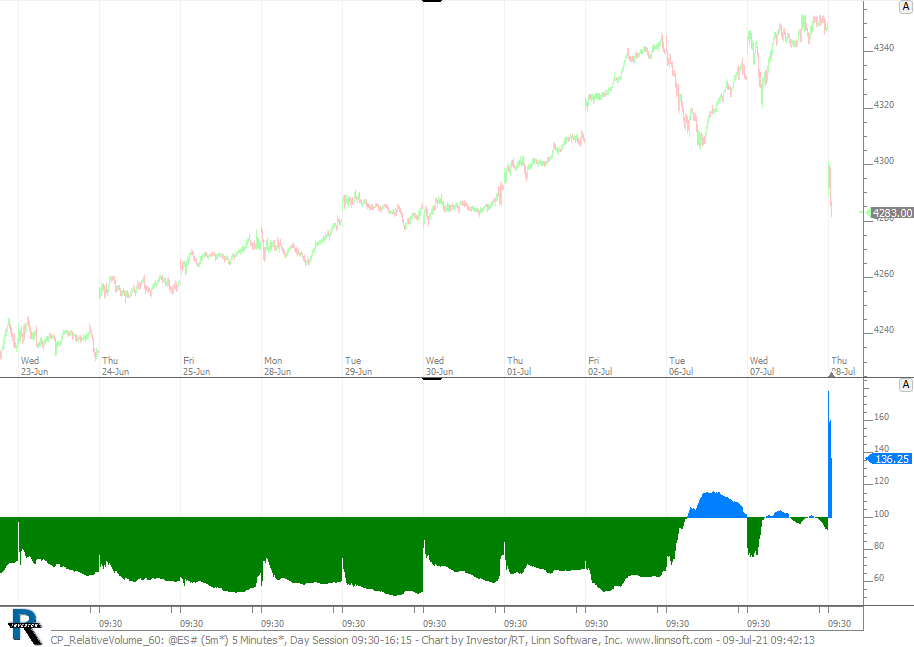 |
CP RelativeVolume 60 (@ES#) cpayne [totalcount]
2 years 10 months ago
Relative Volume - 60 Days. This chart was uploaded by Investor/RT 14.2.7 showing symbol: @ES#. |
View |
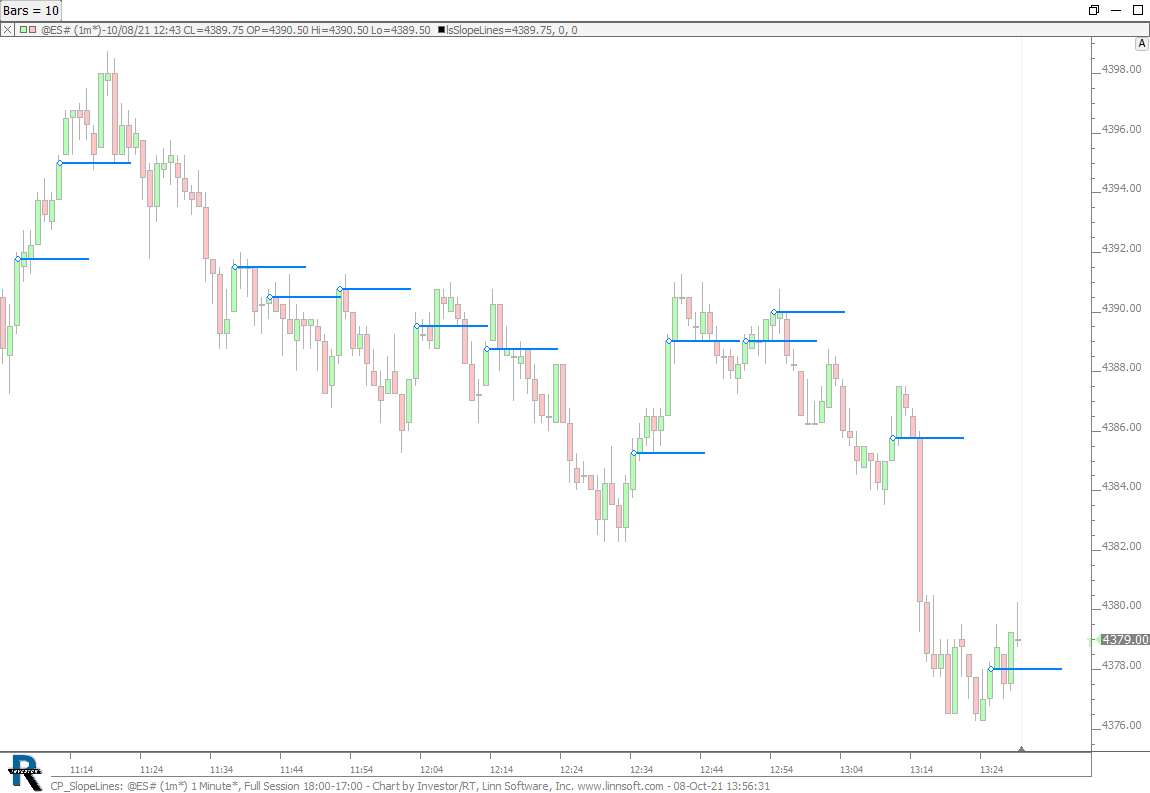 |
CP SlopeLines (@ES#) cpayne [totalcount]
2 years 7 months ago
This chart was uploaded by Investor/RT 15.1.1 showing symbol: @ES#. |
View |
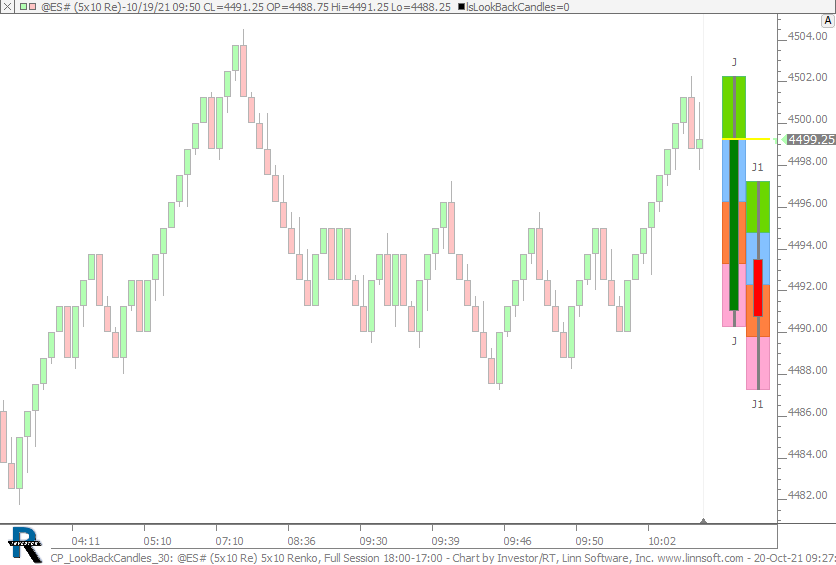 |
CP LookBackCandles 30 (@ES#) cpayne [totalcount]
2 years 7 months ago
LookBackCandles - 30 Minutes. This chart was uploaded by Investor/RT 15.1.1 showing symbol: @ES#. |
View |
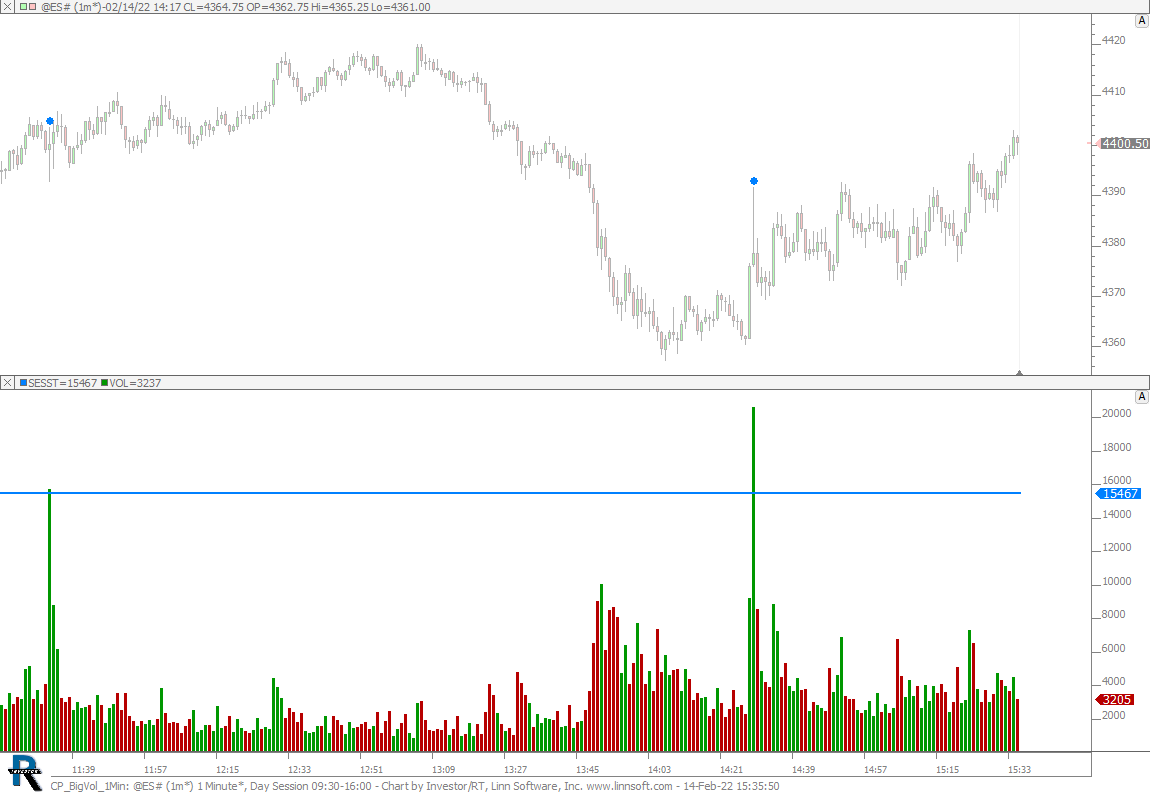 |
CP BigVol 1Min (@ES#) cpayne [totalcount]
2 years 3 months ago
This chart was uploaded by Investor/RT 15.1.2 showing symbol: @ES#. |
View |
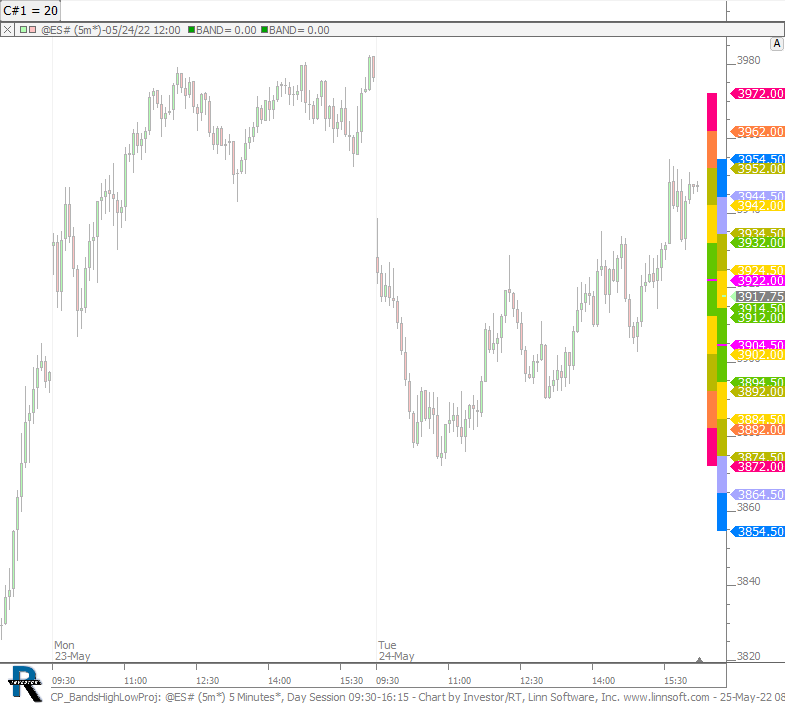 |
CP BandsHighLowProj (@ES#) cpayne [totalcount]
1 year 12 months ago
This chart was uploaded by Investor/RT 15.1.7 showing symbol: @ES#. |
View |
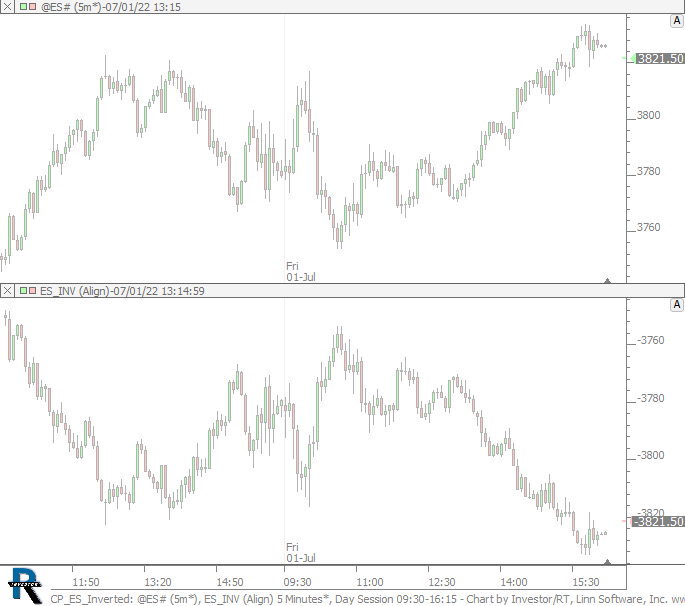 |
CP ES Inverted (@ES#) cpayne [totalcount]
1 year 10 months ago
ES Inverted Chart. This chart was uploaded by Investor/RT 15.1.9 showing symbol: @ES#. |
View |
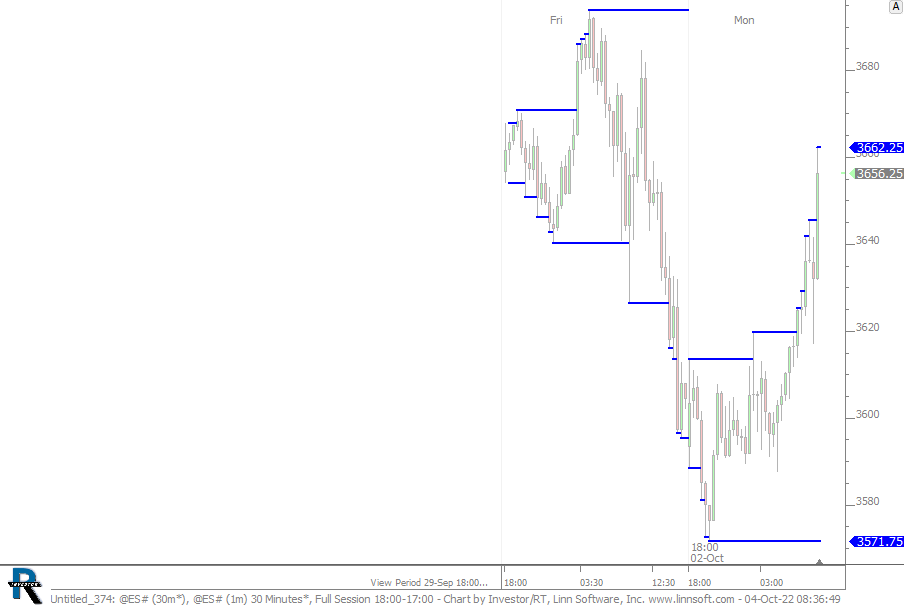 |
Untitled 374 (@ES#) cpayne [totalcount]
1 year 7 months ago
This chart was uploaded by Investor/RT 15.1.11 showing symbol: @ES#. |
View |
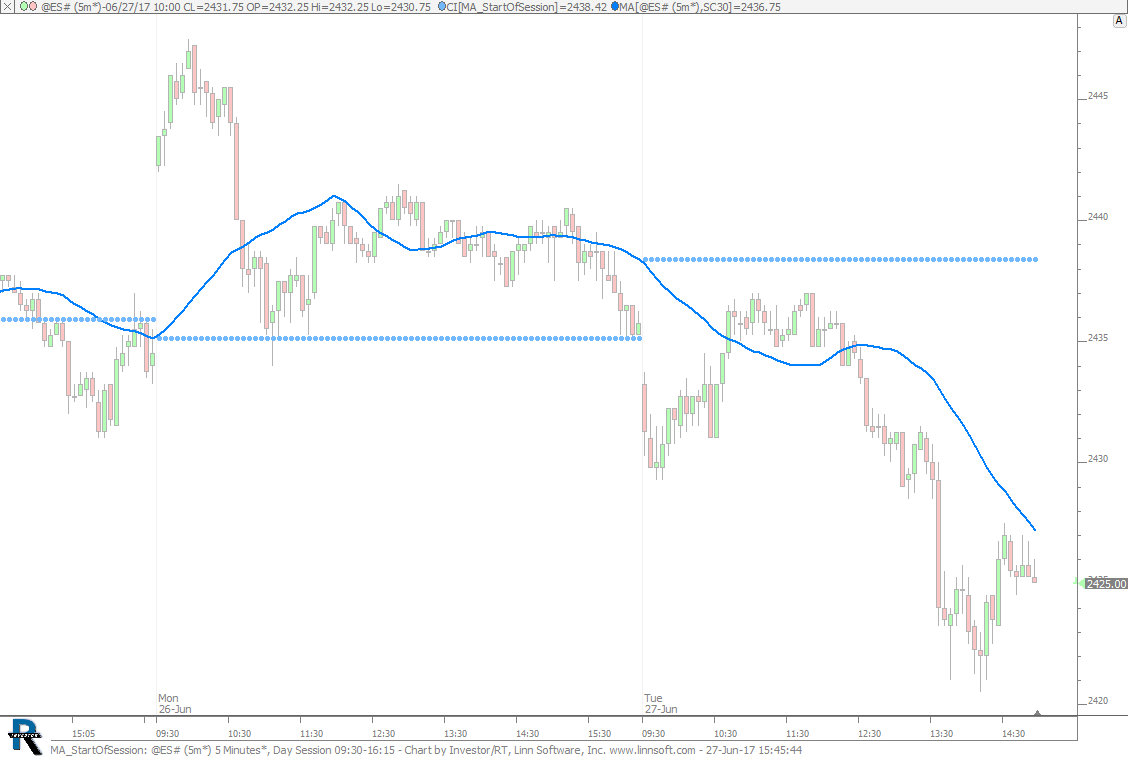 |
MA StartOfSession (@ES#) cpayne [totalcount]
6 years 10 months ago
Referencing Indicator Value at Start of Session. This chart was uploaded by Investor/RT 12.7.7 showing symbol: @ES#. |
View |
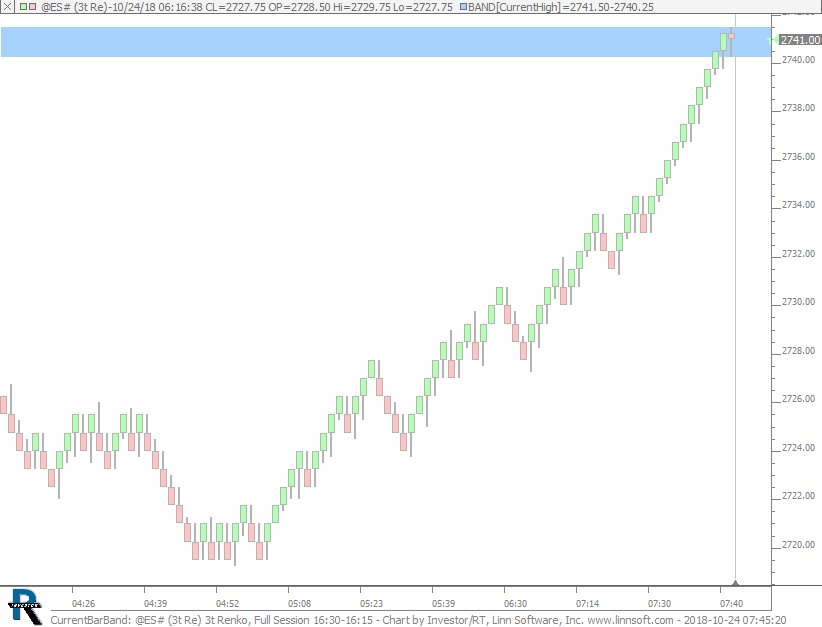 |
CurrentBarBand (@ES#) cpayne [totalcount]
5 years 6 months ago
Band on Current Bar High and Low. This chart was uploaded by Investor/RT 13.5.8 showing symbol: @ES#. |
View |
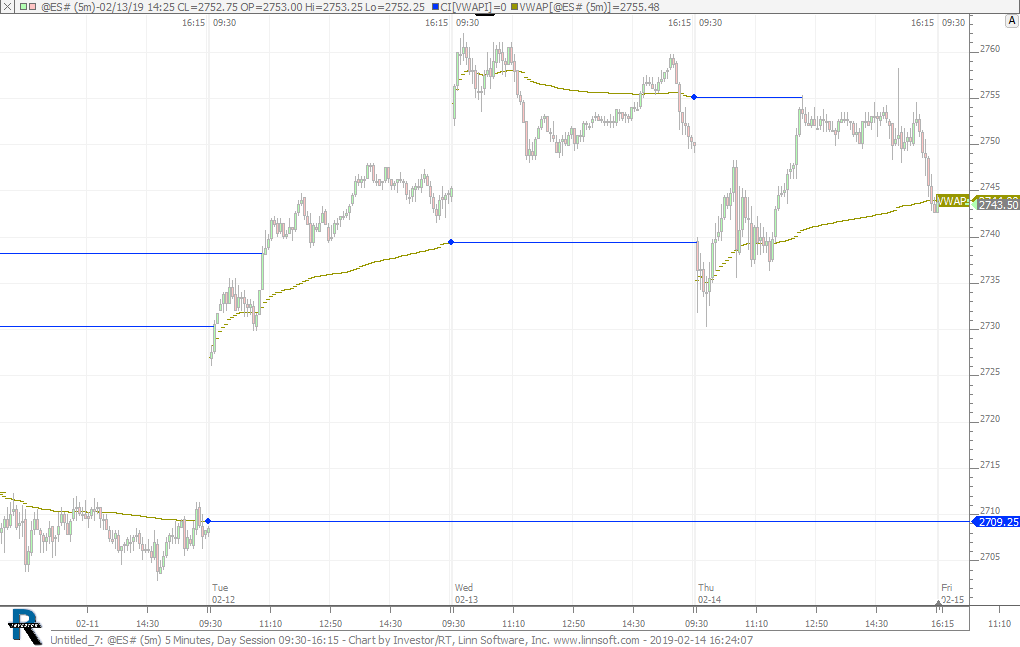 |
Untitled 7 (@ES#) 2 cpayne [totalcount]
5 years 3 months ago
This chart was uploaded by Investor/RT 13.5.19 showing symbol: @ES#. |
View |
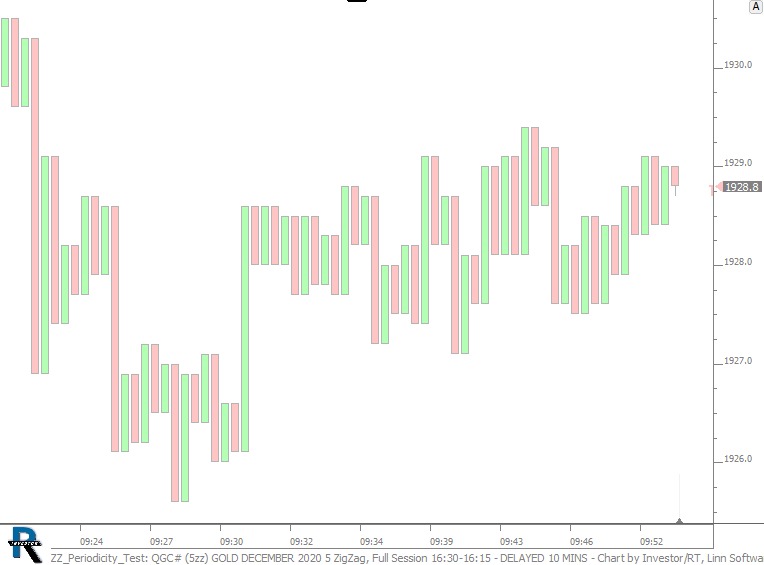 |
ZZ Periodicity Test (QGC#) cpayne [totalcount]
3 years 7 months ago
This chart was uploaded by Investor/RT 14.2.2 showing symbol: QGC#. |
View |
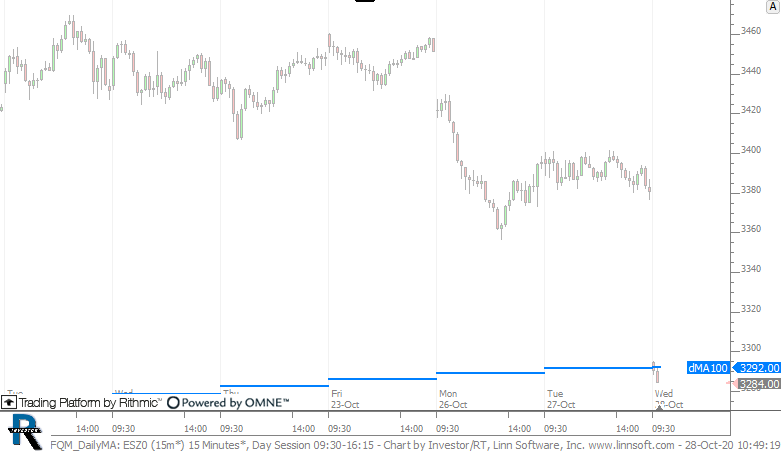 |
FQM DailyMA (ESZ0) cpayne [totalcount]
3 years 6 months ago
This chart was uploaded by Investor/RT 14.2.2 showing symbol: ESZ0. |
View |
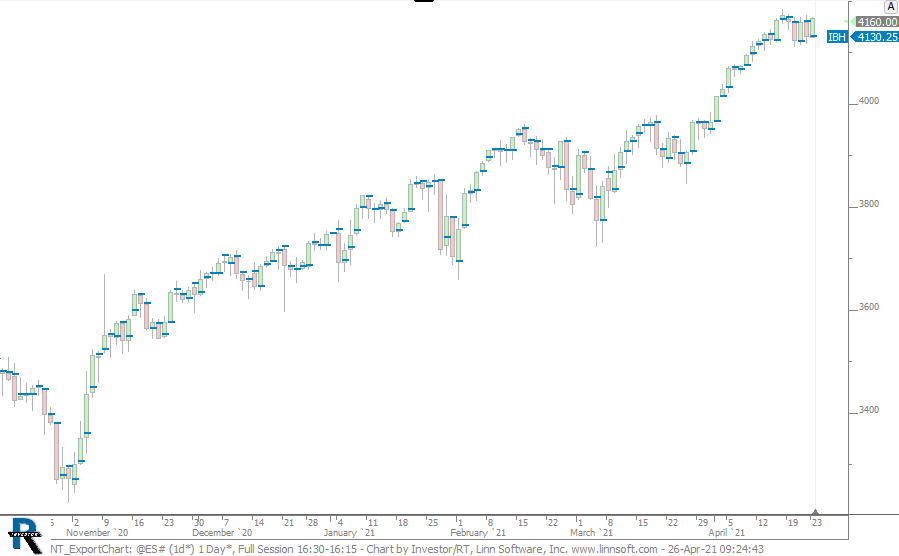 |
NT ExportChart (@ES#) cpayne [totalcount]
3 years 3 weeks ago
This chart was uploaded by Investor/RT 14.2.6 showing symbol: @ES#. |
View |
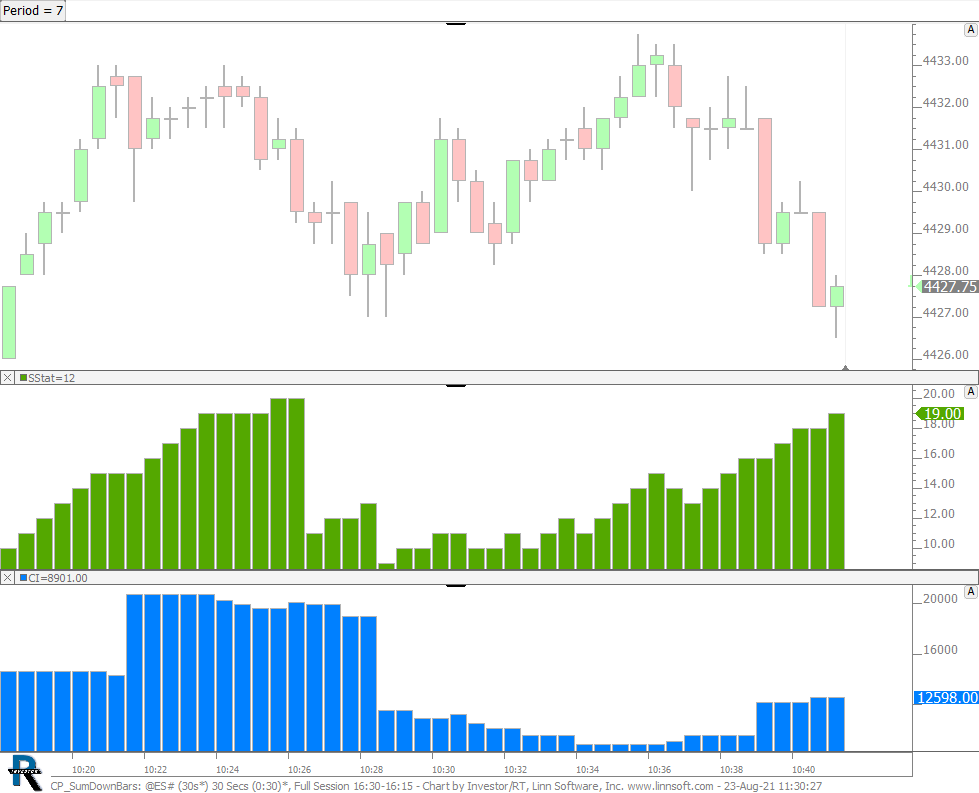 |
CP SumDownBars (@ES#) cpayne [totalcount]
2 years 9 months ago
This chart was uploaded by Investor/RT 15.1.1 showing symbol: @ES#. |
View |
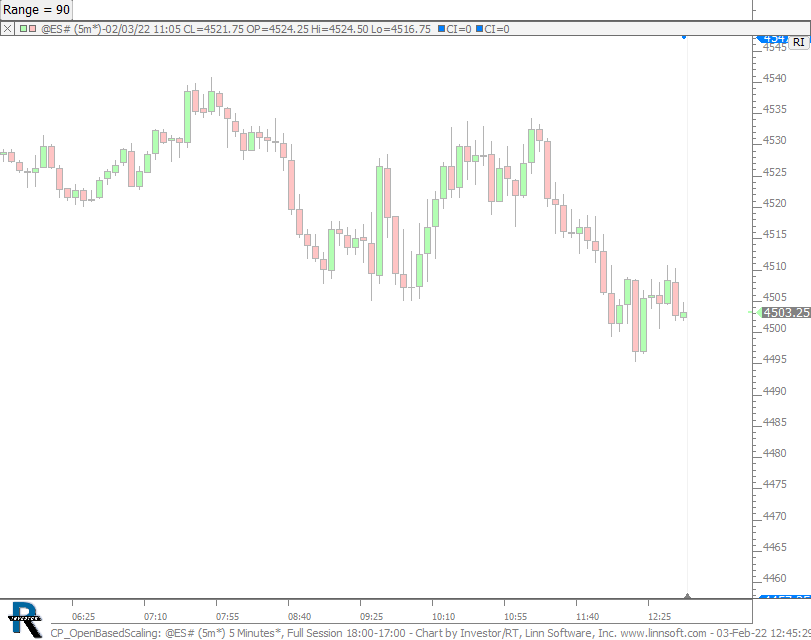 |
CP OpenBasedScaling (@ES#) cpayne [totalcount]
2 years 3 months ago
This chart was uploaded by Investor/RT 15.1.1 showing symbol: @ES#. |
View |
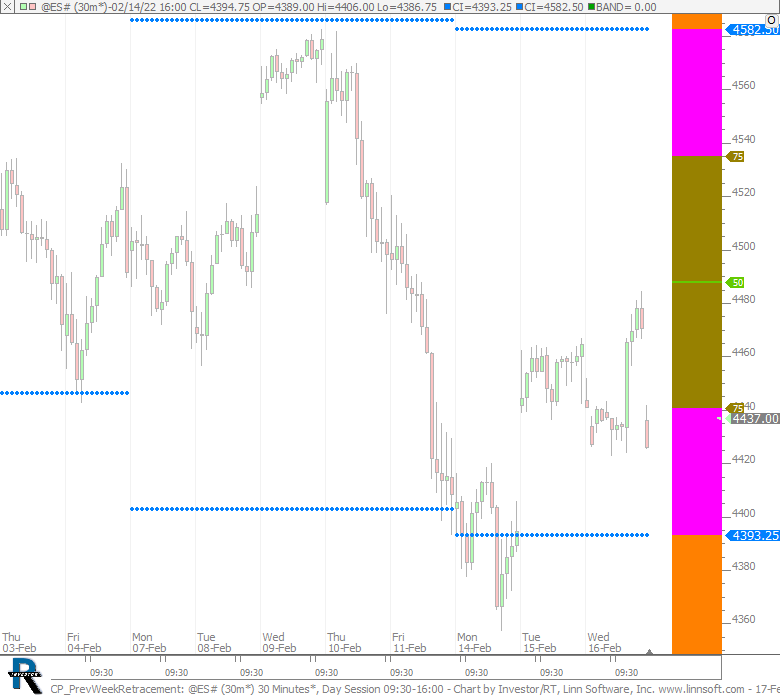 |
CP PrevWeekRetracement (@ES#) cpayne [totalcount]
2 years 3 months ago
This chart was uploaded by Investor/RT 15.1.2 showing symbol: @ES#. |
View |
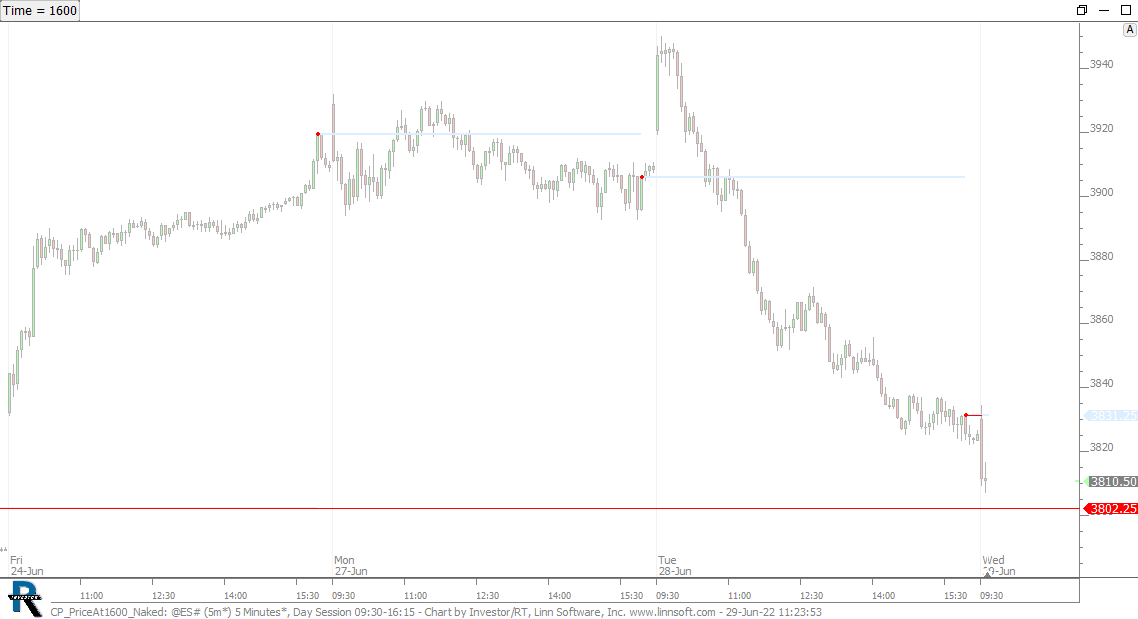 |
CP PriceAt1600 Naked (@ES#) cpayne [totalcount]
1 year 10 months ago
Price at time of day (16:00) - Naked Extended. This chart was uploaded by Investor/RT 15.1.9 showing symbol: @ES#. |
View |
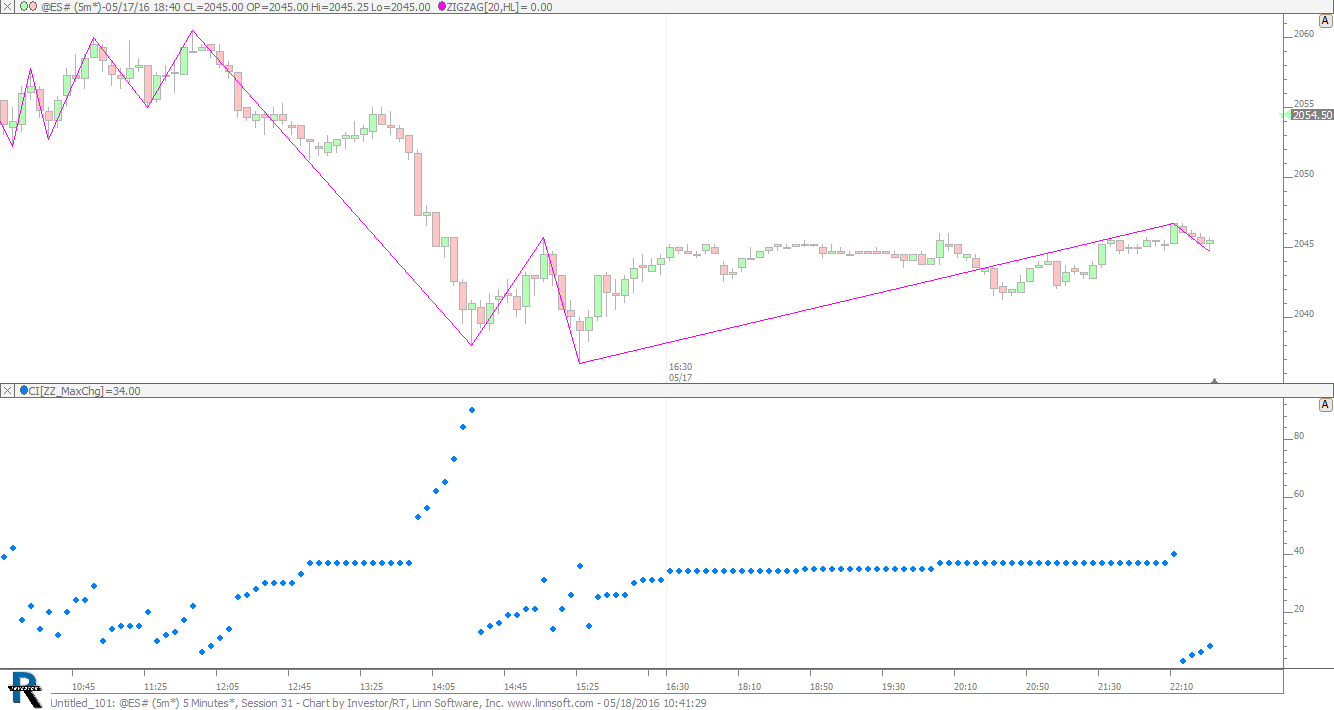 |
Untitled 101 (@ES#) cpayne [totalcount]
8 years 3 days ago
This chart was uploaded by Investor/RT 12.5.9 showing symbol: @ES#. |
View |
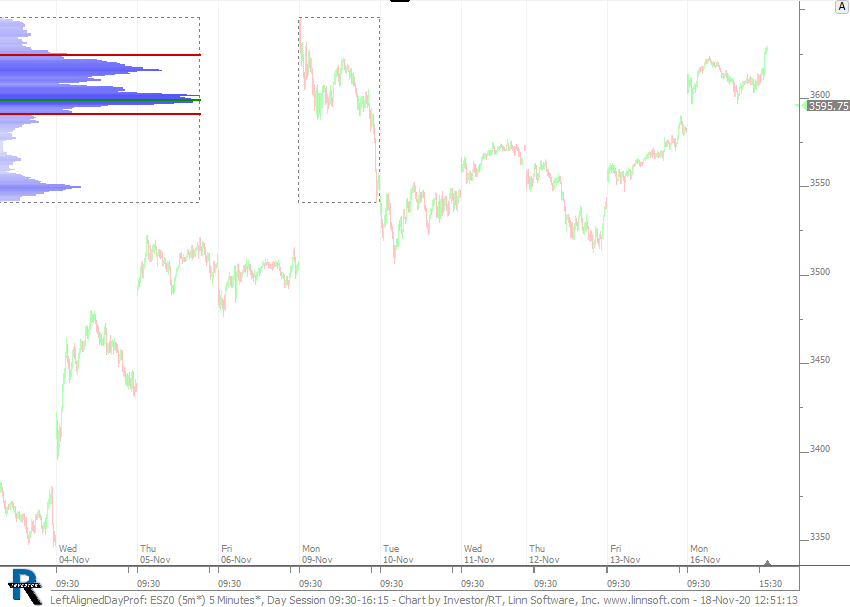 |
LeftAlignedDayProf (ESZ0) cpayne [totalcount]
3 years 6 months ago
This chart was uploaded by Investor/RT 14.2.4 showing symbol: ESZ0. |
View |
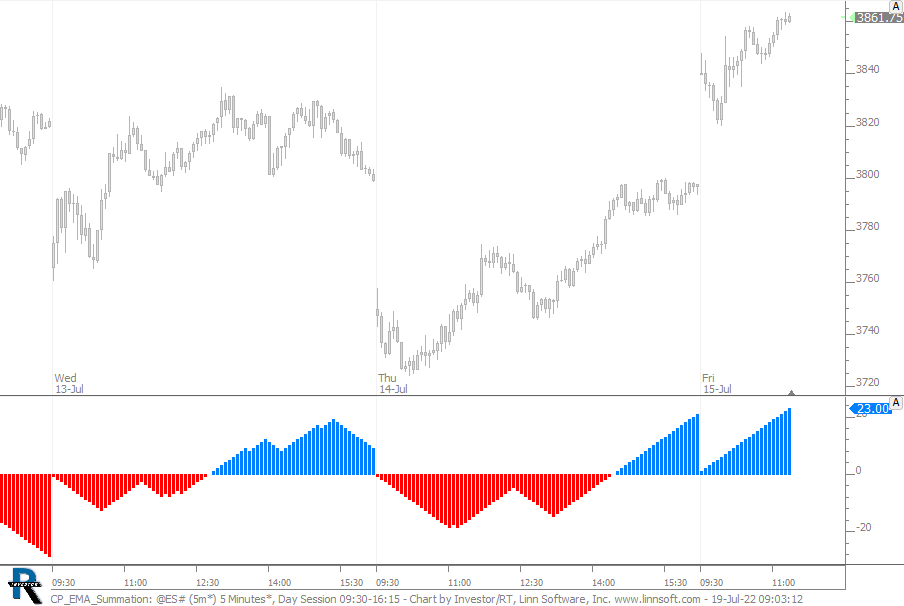 |
CP EMA Summation (@ES#) cpayne [totalcount]
1 year 10 months ago
This chart was uploaded by Investor/RT 15.1.9 showing symbol: @ES#. |
View |
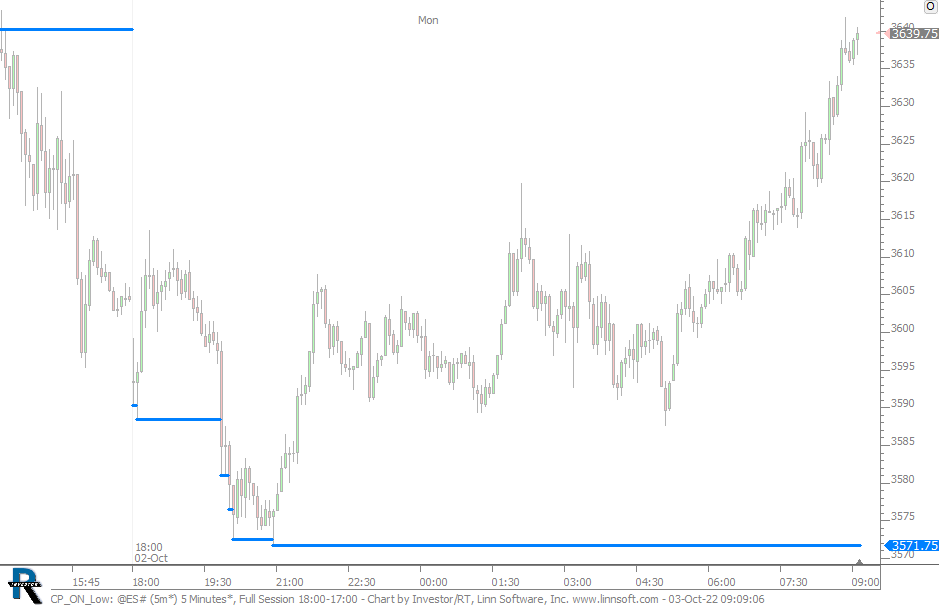 |
CP ON Low (@ES#) cpayne [totalcount]
1 year 7 months ago
Overnight Low using MPD / SESST. This chart was uploaded by Investor/RT 15.1.11 showing symbol: @ES#. |
View |
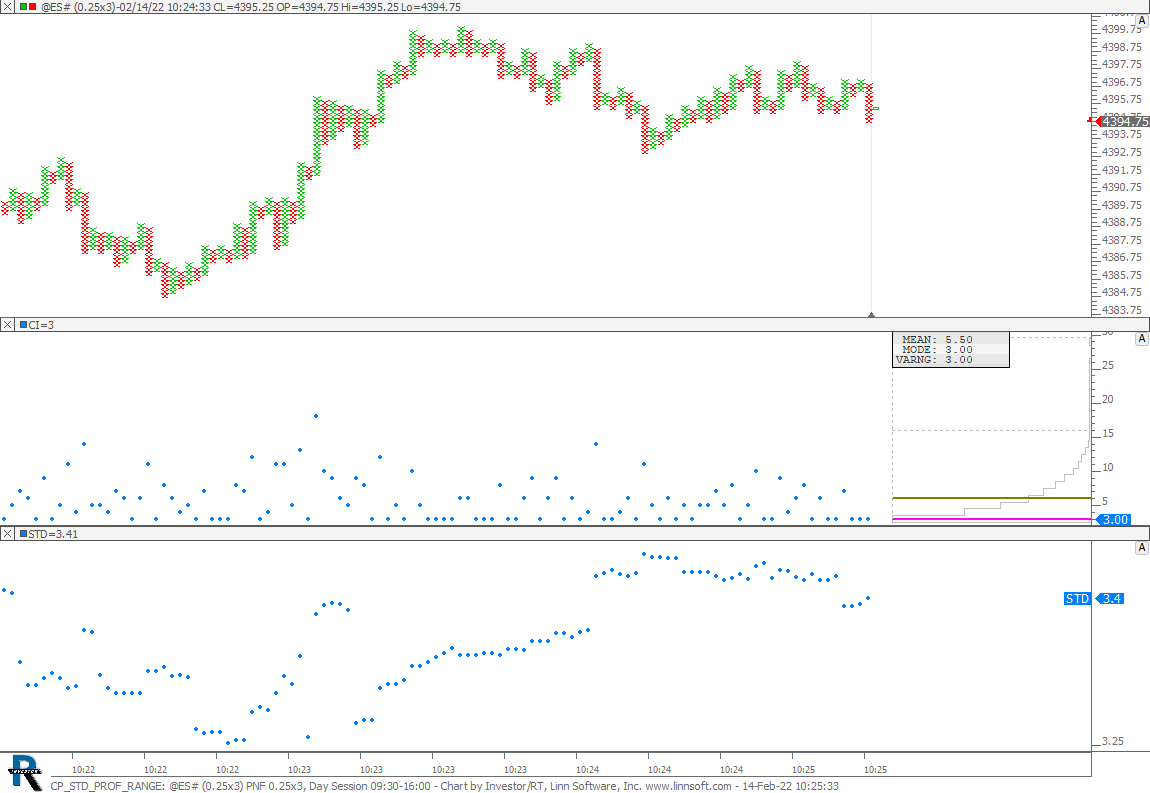 |
CP STD PROF RANGE (@ES#) cpayne [totalcount]
2 years 3 months ago
This chart was uploaded by Investor/RT 15.1.2 showing symbol: @ES#. |
View |
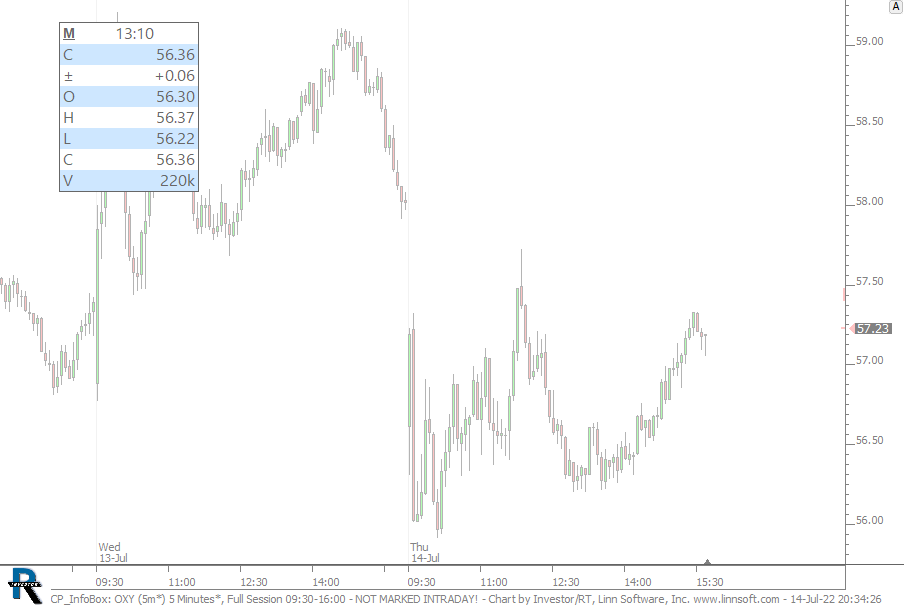 |
CP InfoBox (OXY) cpayne [totalcount]
1 year 10 months ago
This chart was uploaded by Investor/RT 15.1.9 showing symbol: OXY. |
View |