 |
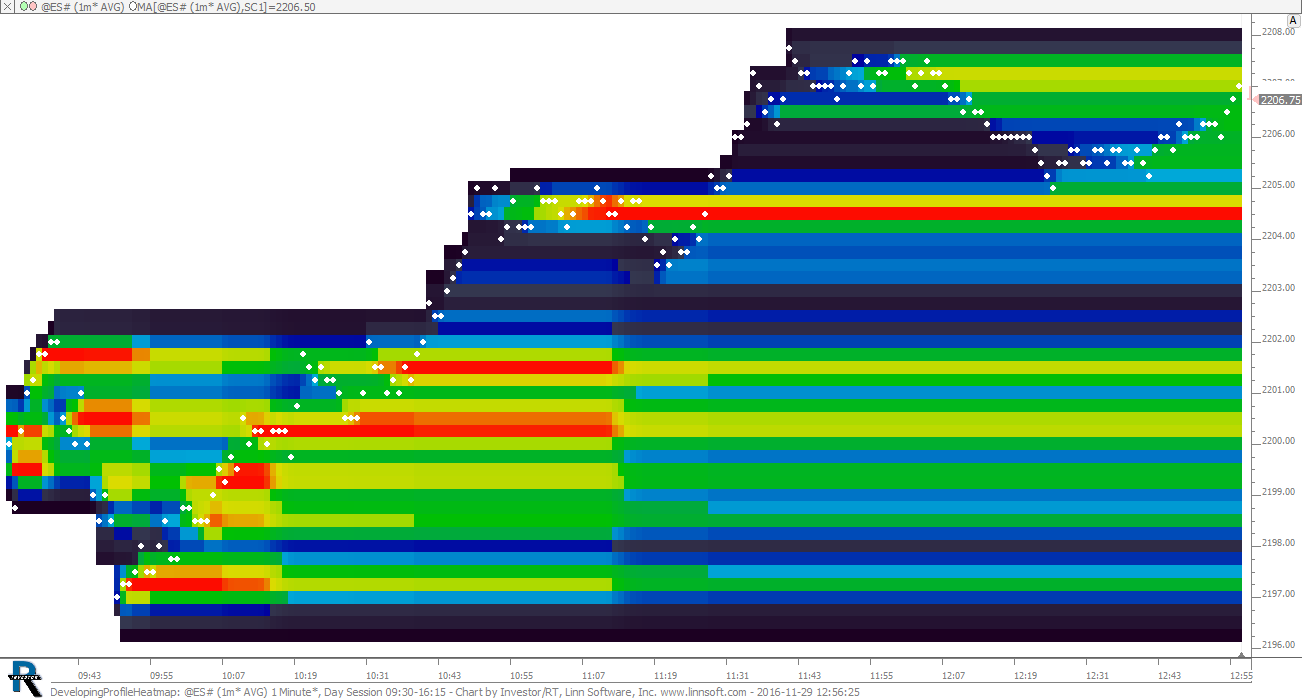
DevelopingProfileHeatmap (@ES#) cpayne [totalcount]
7 years 5 months ago
Developing Profile with Heatmap. This chart was uploaded by Investor/RT 12.7.1 showing symbol: @ES#. |
View |
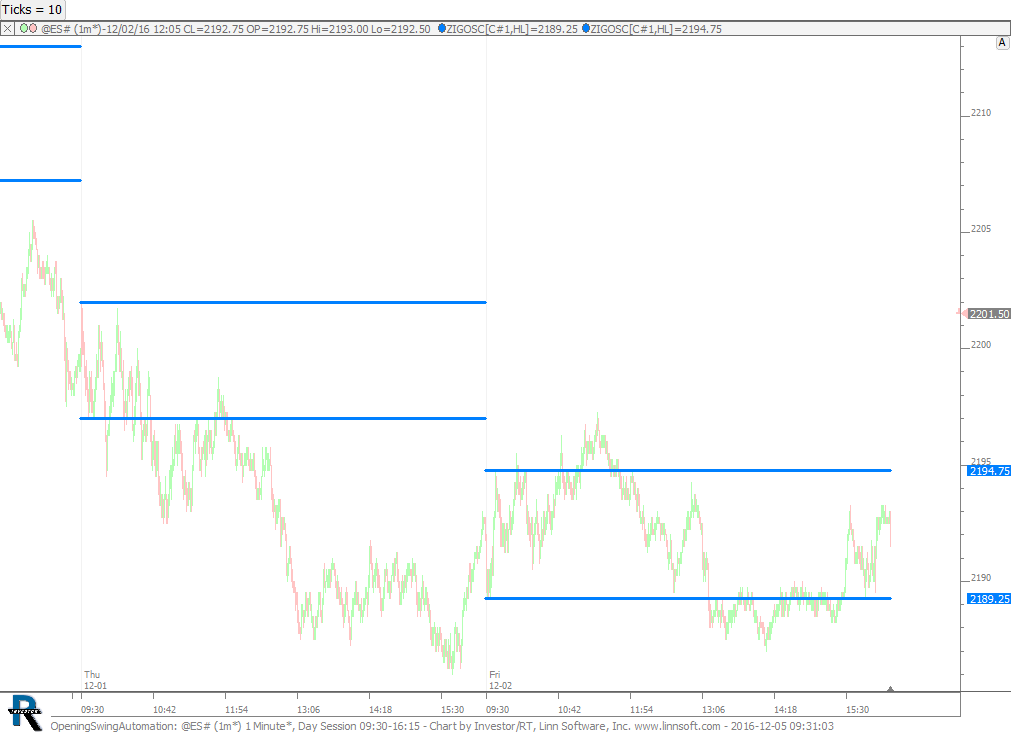 |
OpeningSwingAutomation (@ES#) cpayne [totalcount]
7 years 5 months ago
Opening Swing Automation. This chart was uploaded by Investor/RT 12.7.1 showing symbol: @ES#. |
View |
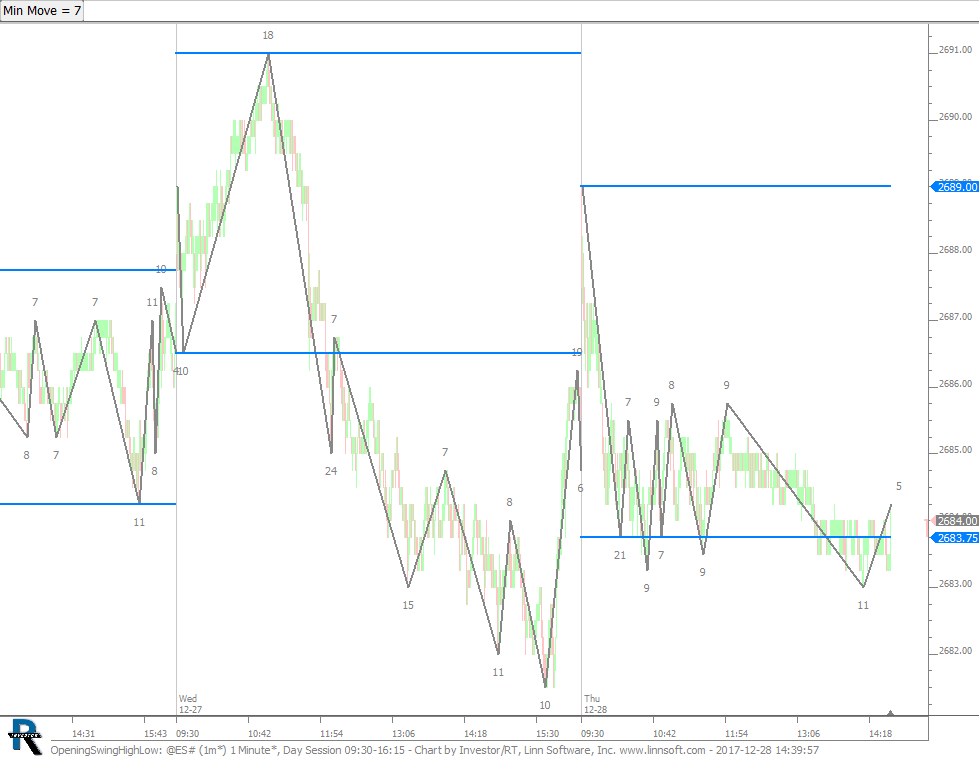 |
OpeningSwingHighLow (@ES#) cpayne [totalcount]
6 years 4 months ago
Opening Swing High and Low. This chart was uploaded by Investor/RT 13.1.4 showing symbol: @ES#. |
View |
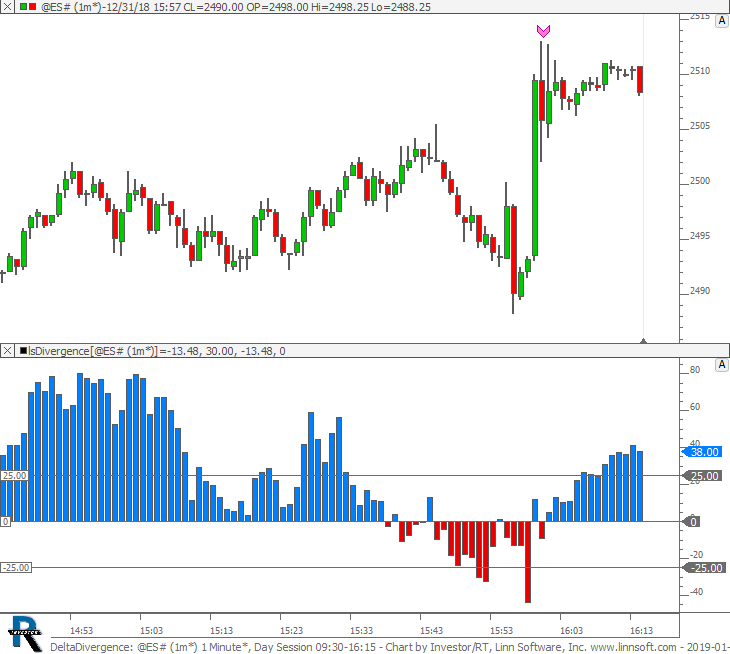 |
DeltaDivergence (@ES#) cpayne [totalcount]
5 years 4 months ago
Delta Divergence. This chart was uploaded by Investor/RT 12.5.9 showing symbol: @ES#. |
View |
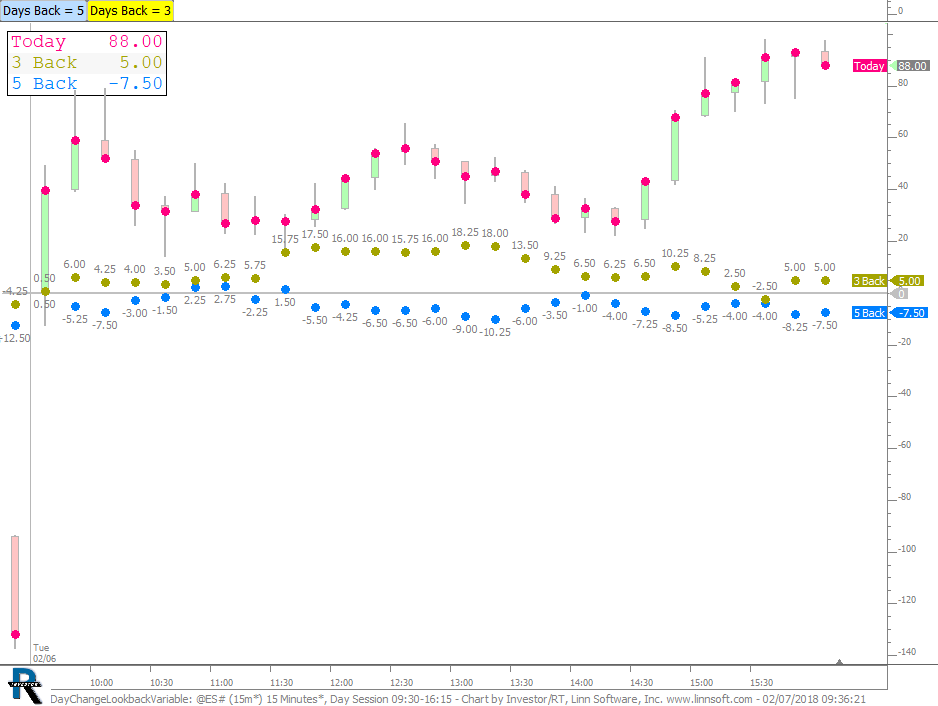 |
DayChangeLookbackVariable (@ES#) cpayne [totalcount]
6 years 3 months ago
Day Change Lookback - Compare today's Day Change price movement from open with that of any past days. Use the buttons at top to control the number of days back (2 overlays). |
View |
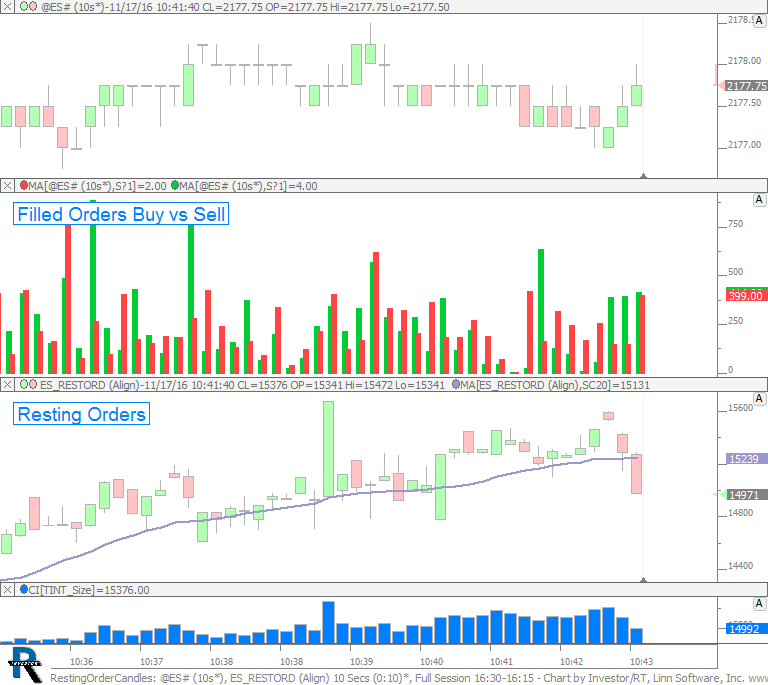 |
RestingOrderCandles (@ES#) cpayne [totalcount]
7 years 5 months ago
Resting Order Candles. This chart is explained in the video Resting Order Candles. |
View |
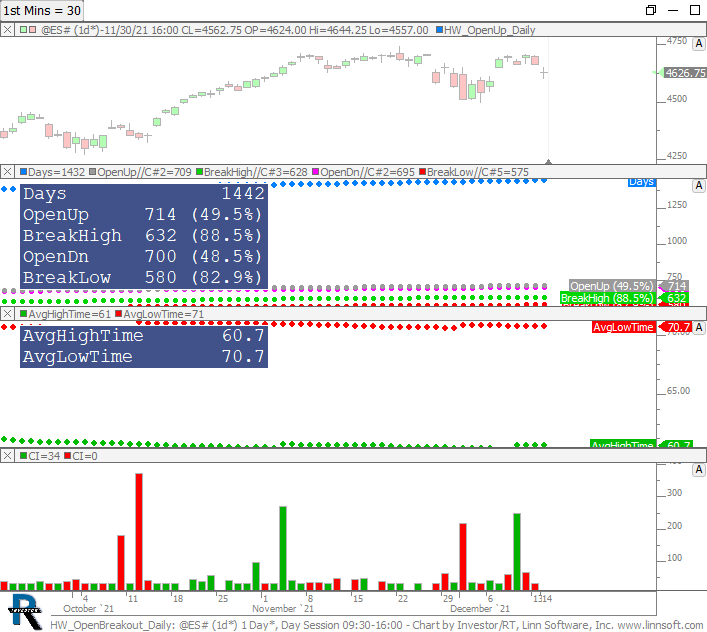 |
HW OpenBreakout Daily (@ES#) cpayne [totalcount]
2 years 4 months ago
Homework - Open Period Breakout Statistics. This chart was uploaded by Investor/RT 12.7.1 showing symbol: @ES#. |
View |
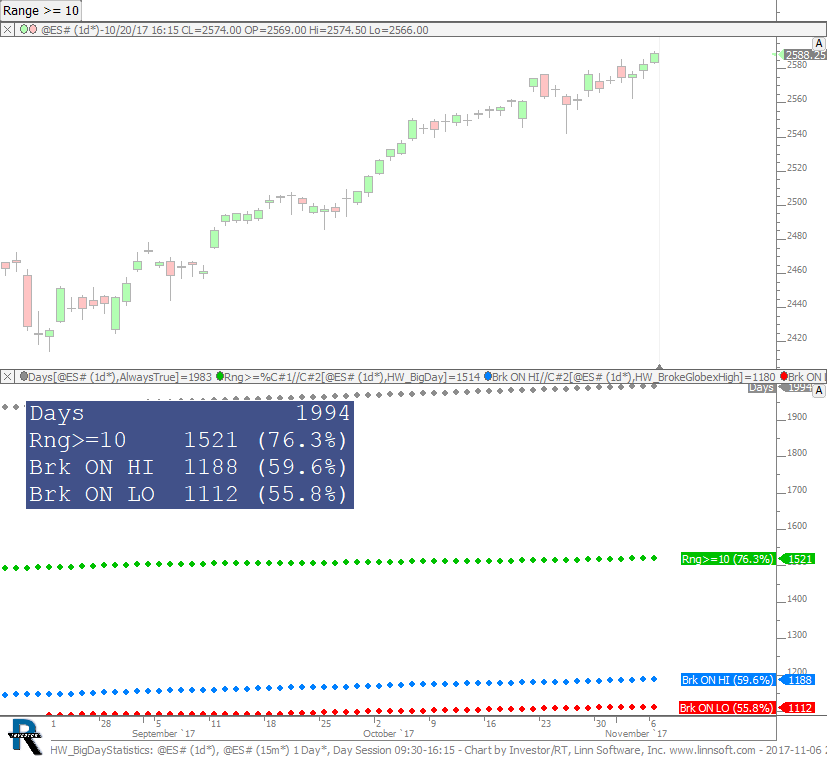 |
HW BigDayStatistics (@ES#) cpayne [totalcount]
6 years 6 months ago
Homework. Number of Big Days (Use Button For Min Range), and Number of Days we break overnight high and low (with percentages). |
View |
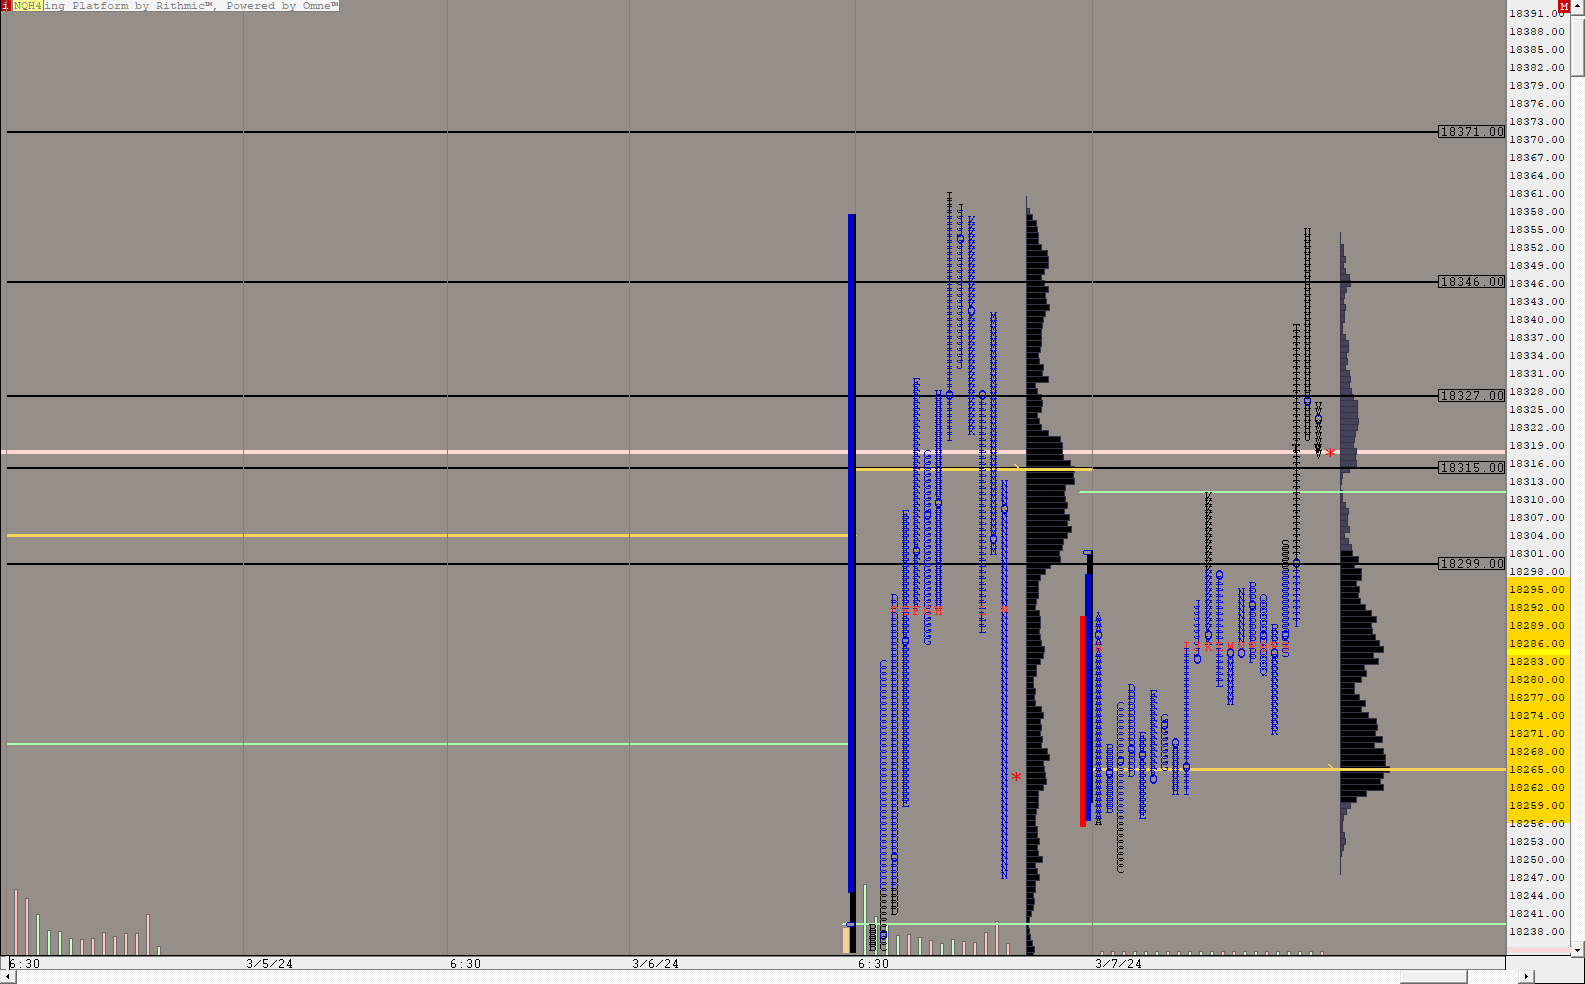 |
NQDAYTPO (NQH4) ES42 [totalcount]
2 months 1 day ago
This chart was uploaded by Investor/RT 14.5.6 showing symbol: NQH4. |
View |
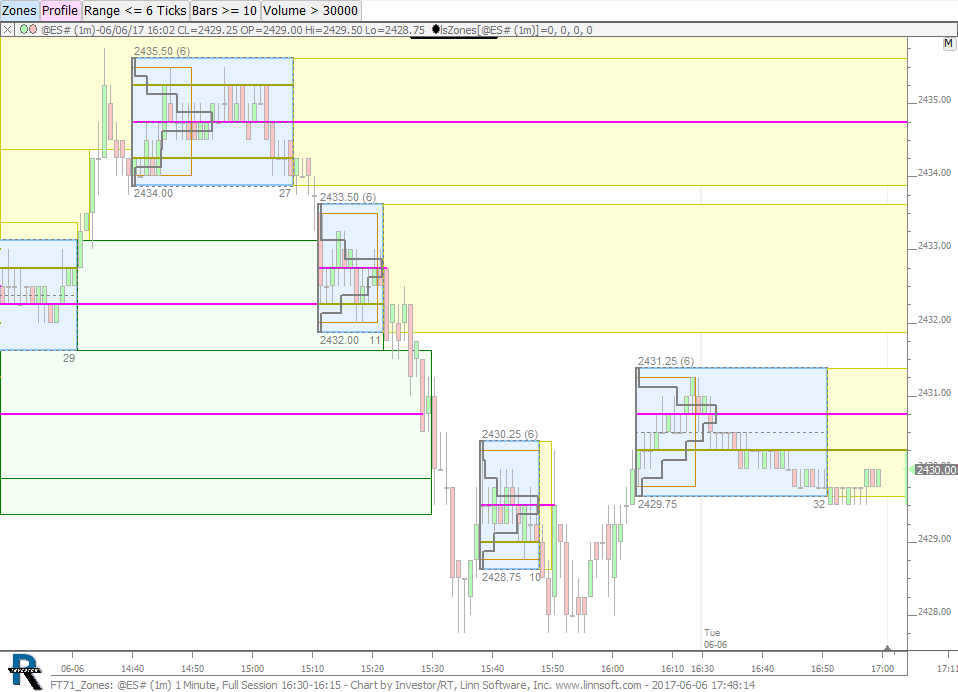 |
FT71 Zones (@ES#) cpayne [totalcount]
6 years 11 months ago
Zones chart used in FuturesTrader71 Webinar on June 6, 2017. This chart was uploaded by Investor/RT 12.7.5 showing symbol: @ES#. |
View |
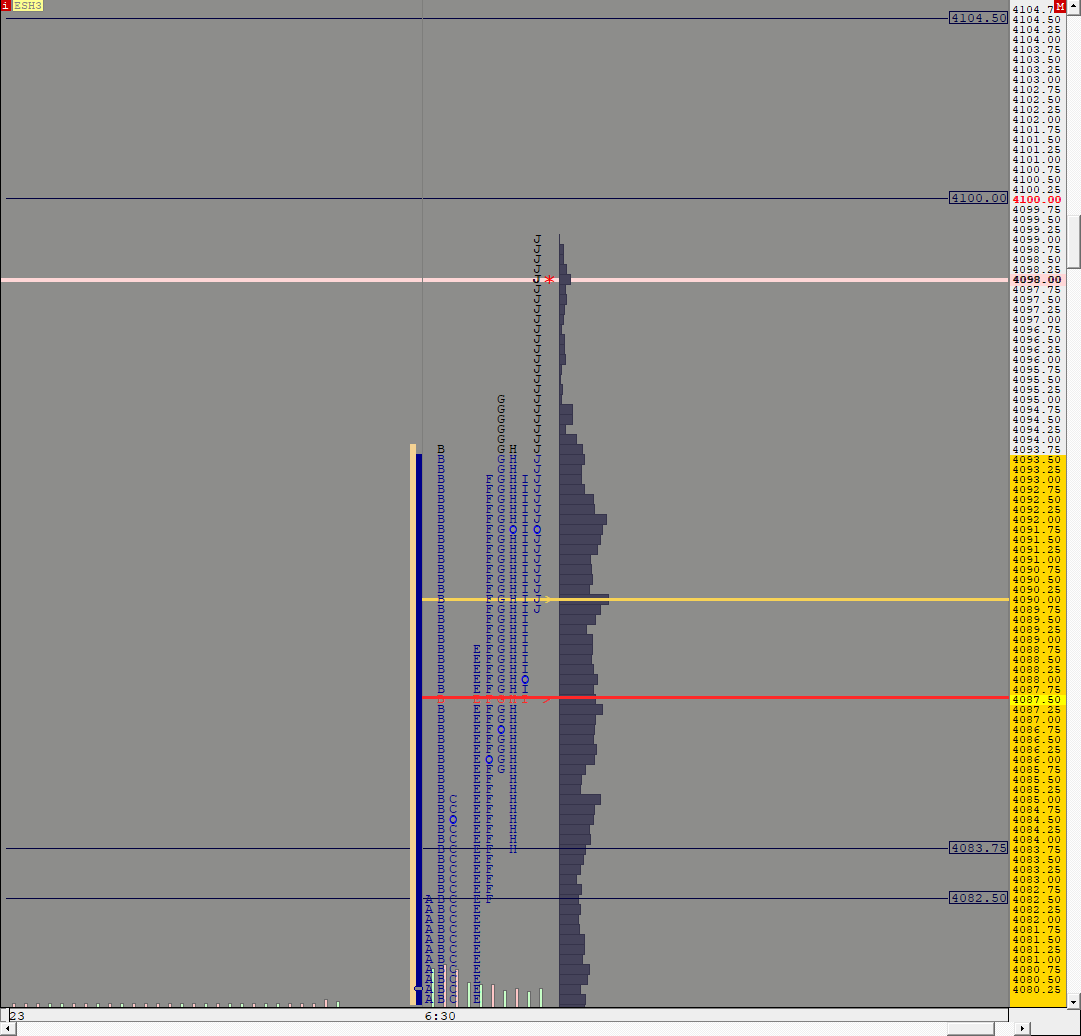 |
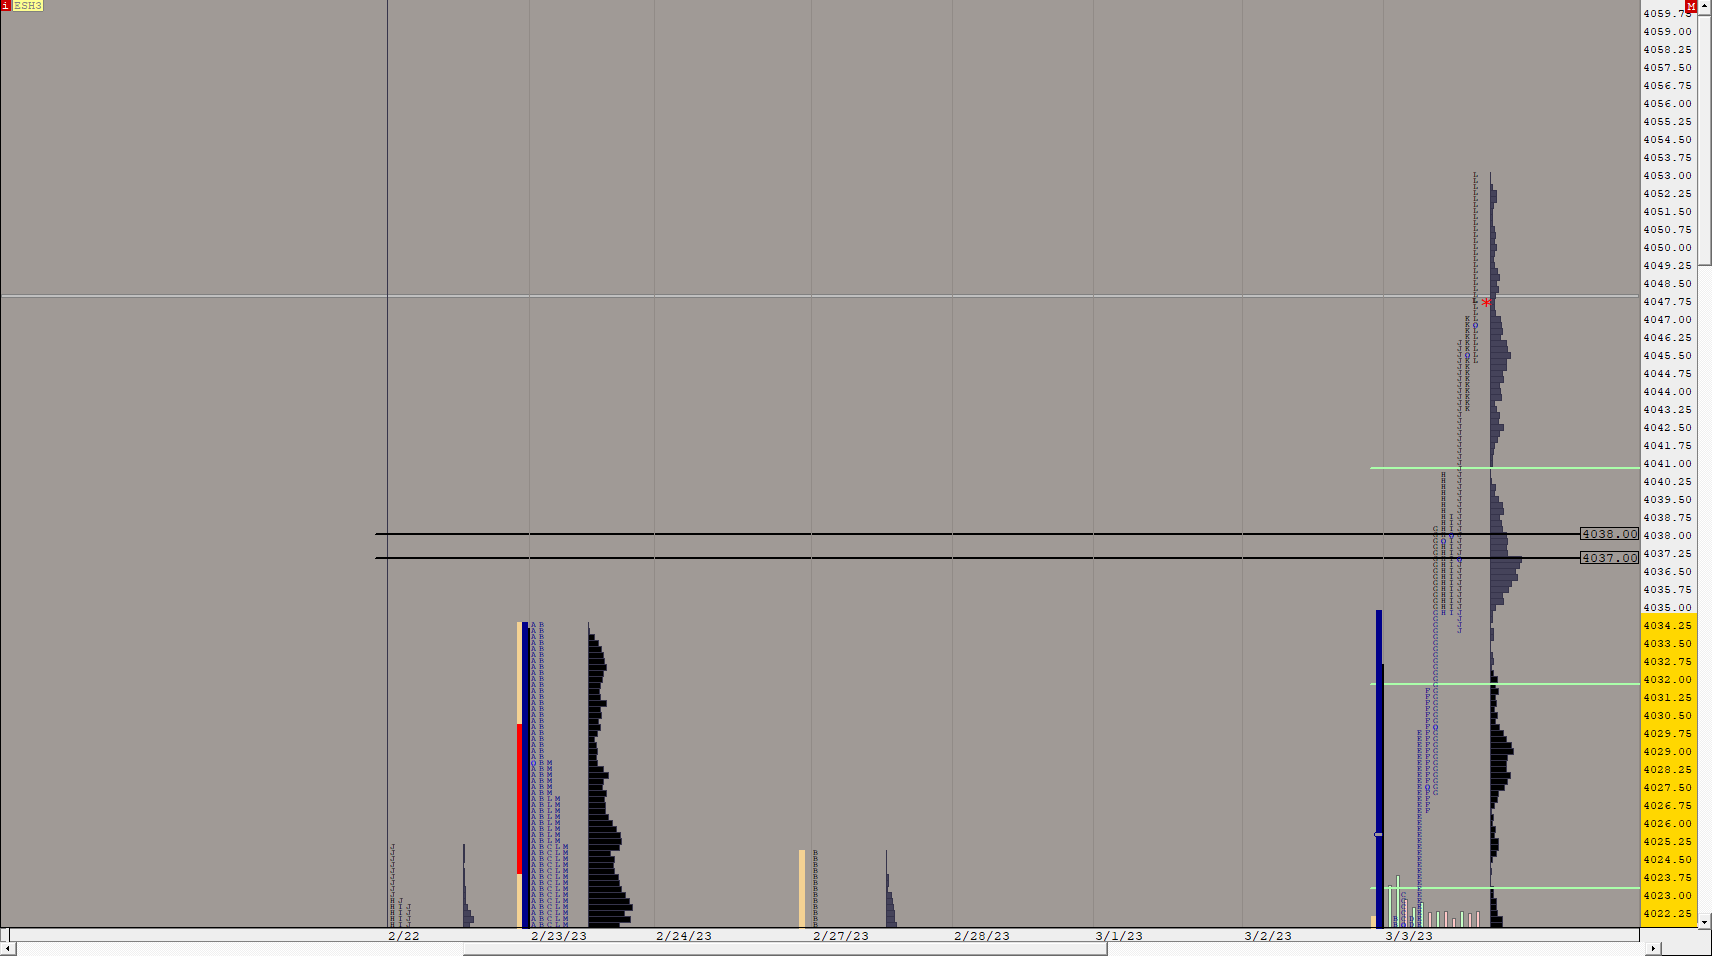
ES RTH (ESH3) ES42 [totalcount]
1 year 3 months ago
This chart was uploaded by Investor/RT 14.5.4 showing symbol: ESH3. |
View |
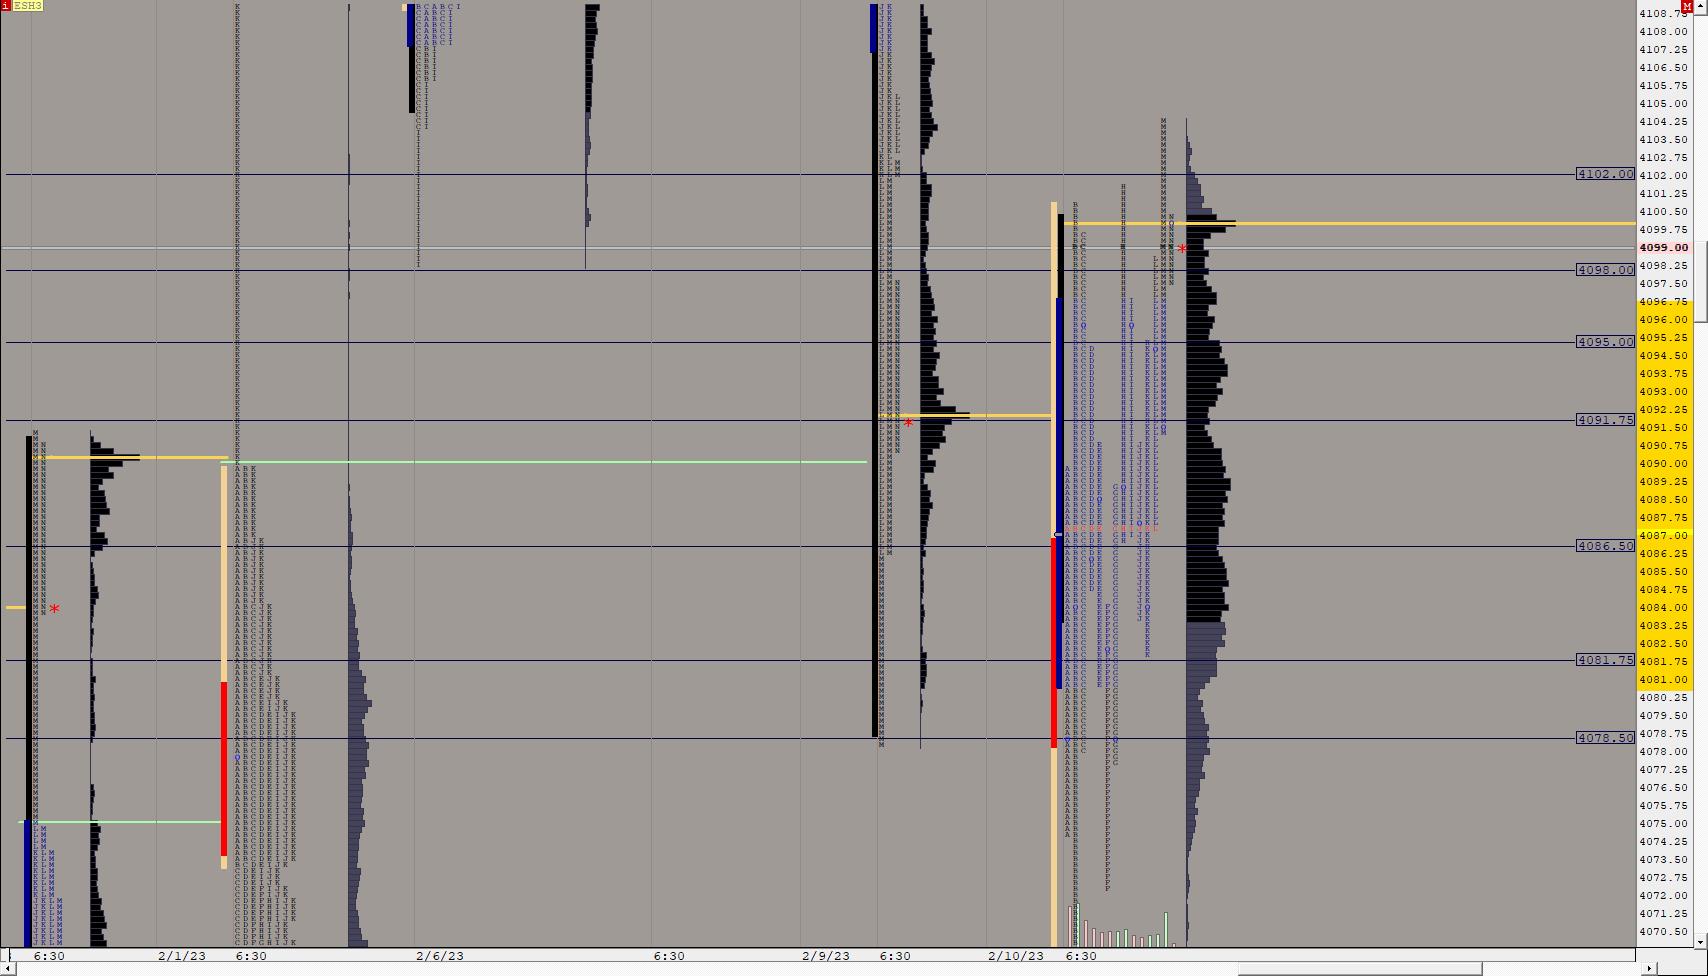 |
TEST TPO (ESH3) ES42 [totalcount]
1 year 2 months ago
This chart was uploaded by Investor/RT 14.5.4 showing symbol: ESH3. |
View |
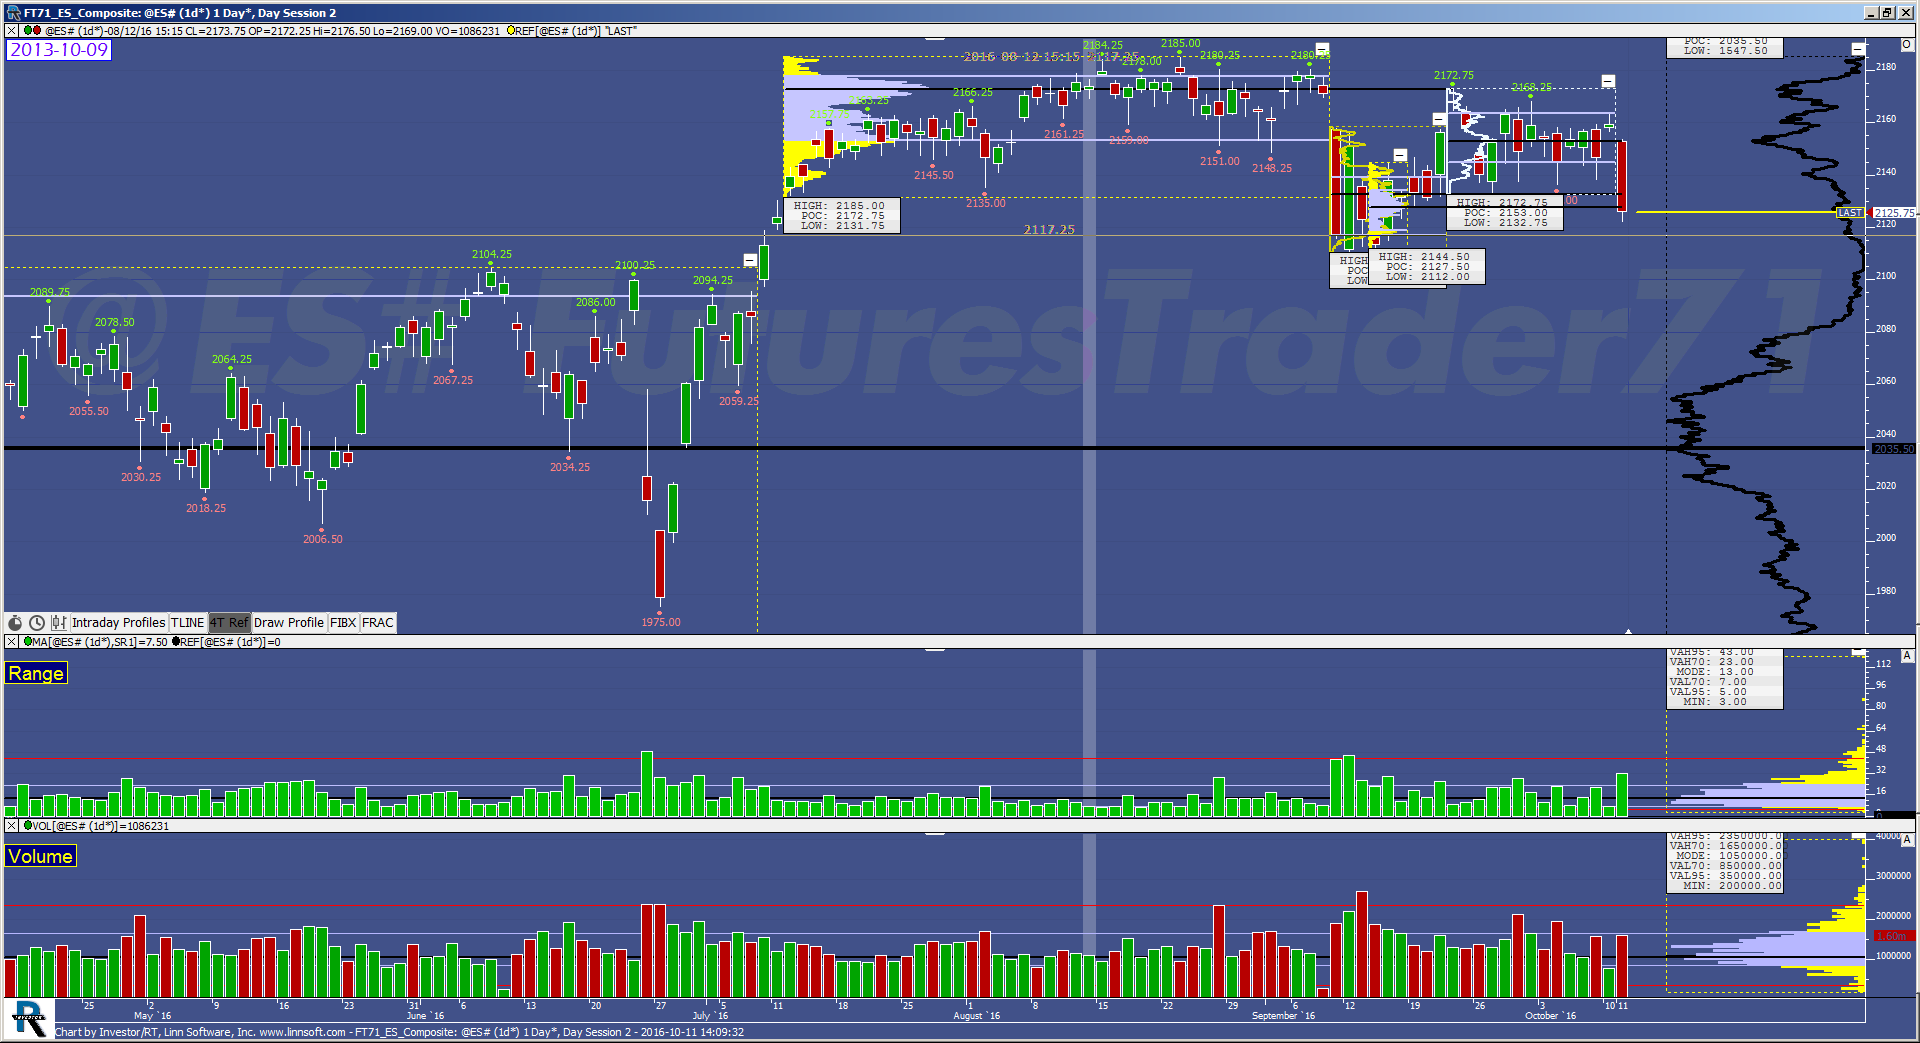 |
FT71 ES Composite (@ES#) futurestrader71 [totalcount]
7 years 7 months ago
ES Composite Day Session chart showing the composite profile as well as the dynamic studies of Range and Volume per day. This is used for the big picture and is key to analyzing the market's bias... |
View |
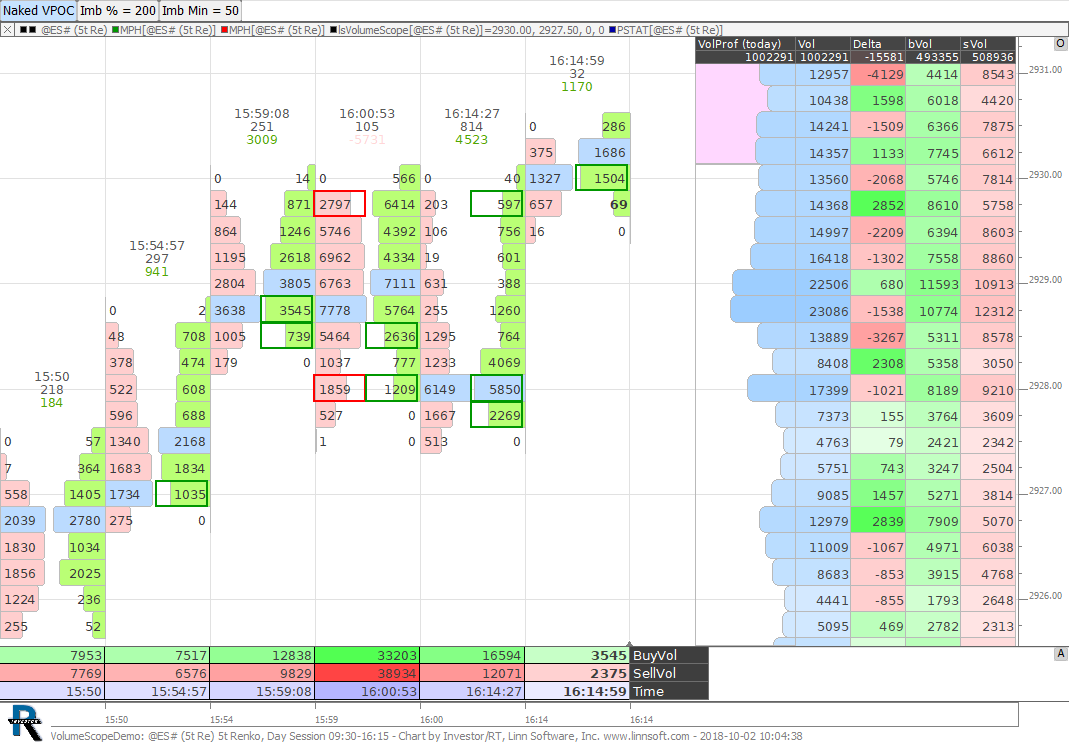 |
VolumeScope® Demo (@ES#) cpayne [totalcount]
5 years 7 months ago
VolumeScope® Demo Chart. This chart was uploaded by Investor/RT 13.1.1 showing symbol: @ES#. |
View |
 |
ESDAYTPOALT (ESH3) ES42 [totalcount]
1 year 2 months ago
This chart was uploaded by Investor/RT 14.5.4 showing symbol: ESH3. |
View |
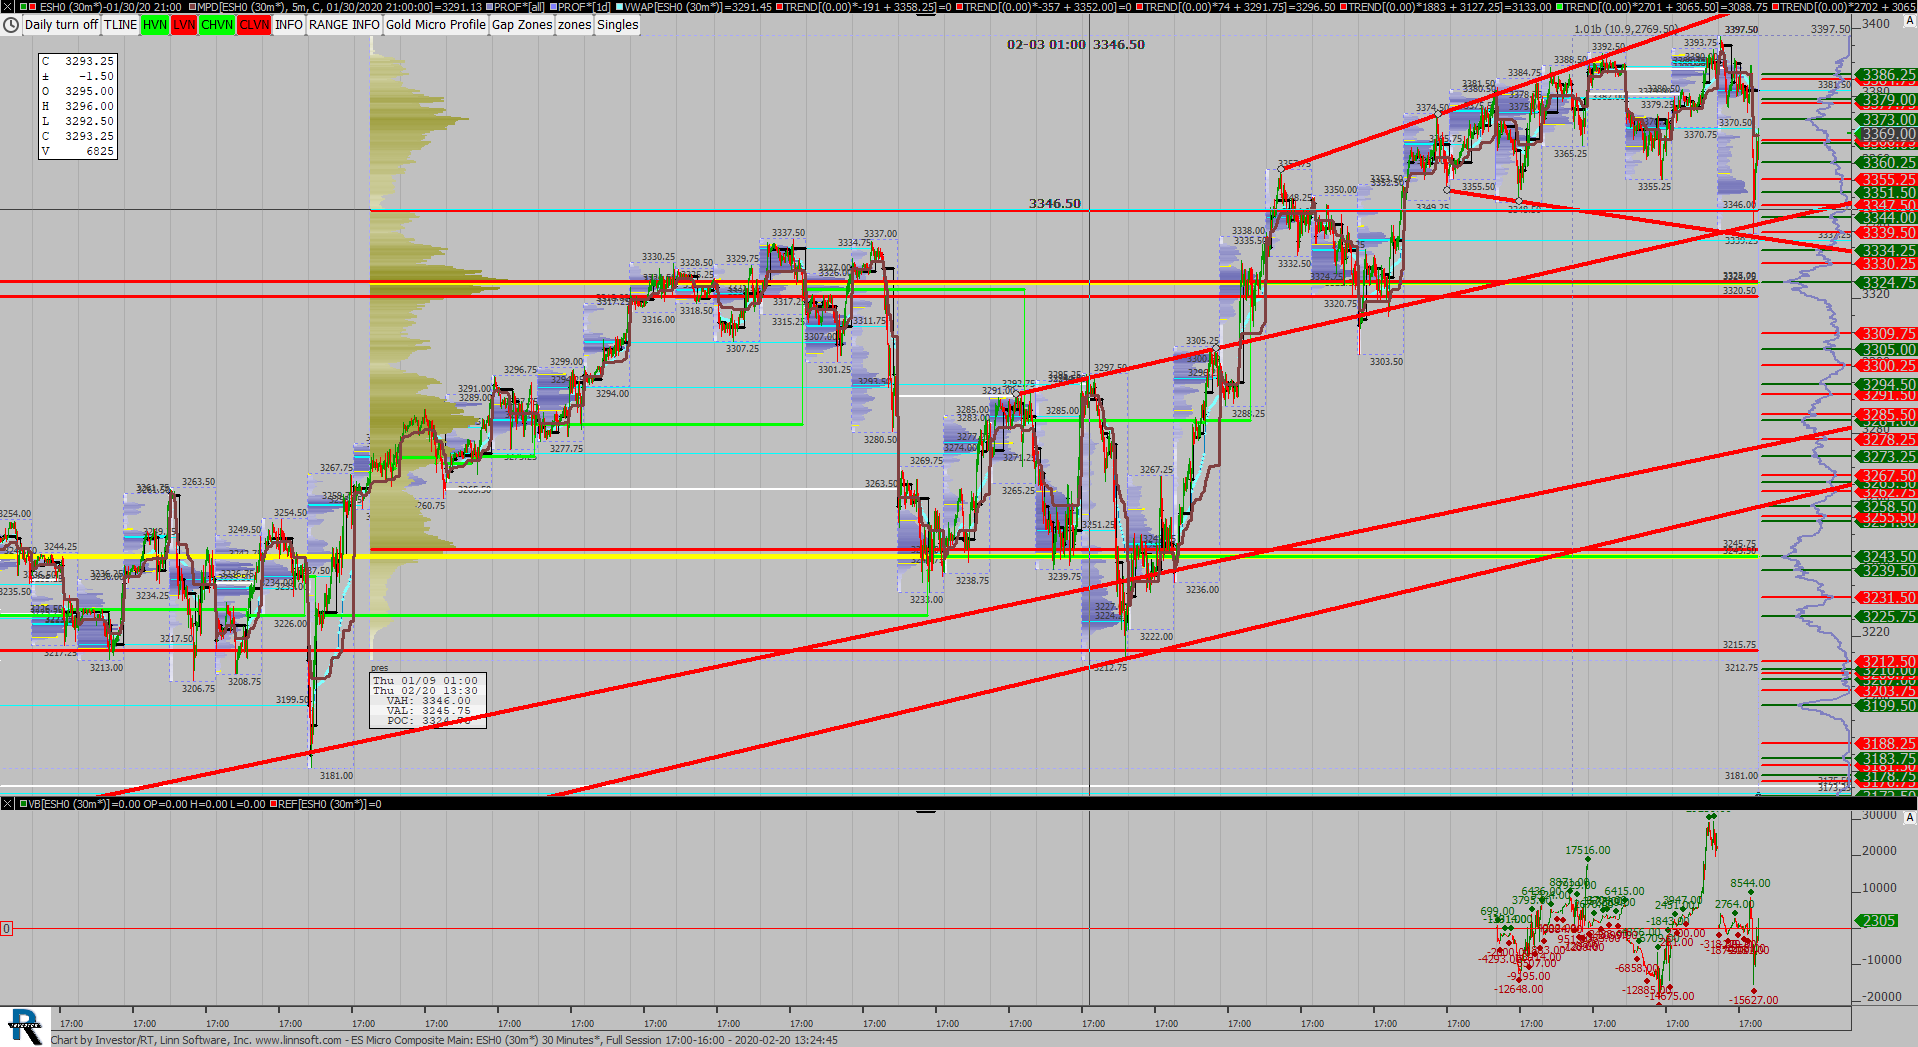 |
ES Micro Composite Main (ESH0) scottz46 [totalcount]
4 years 2 months ago
This chart was uploaded by Investor/RT 13.6.3 showing symbol: ESH0. |
View |
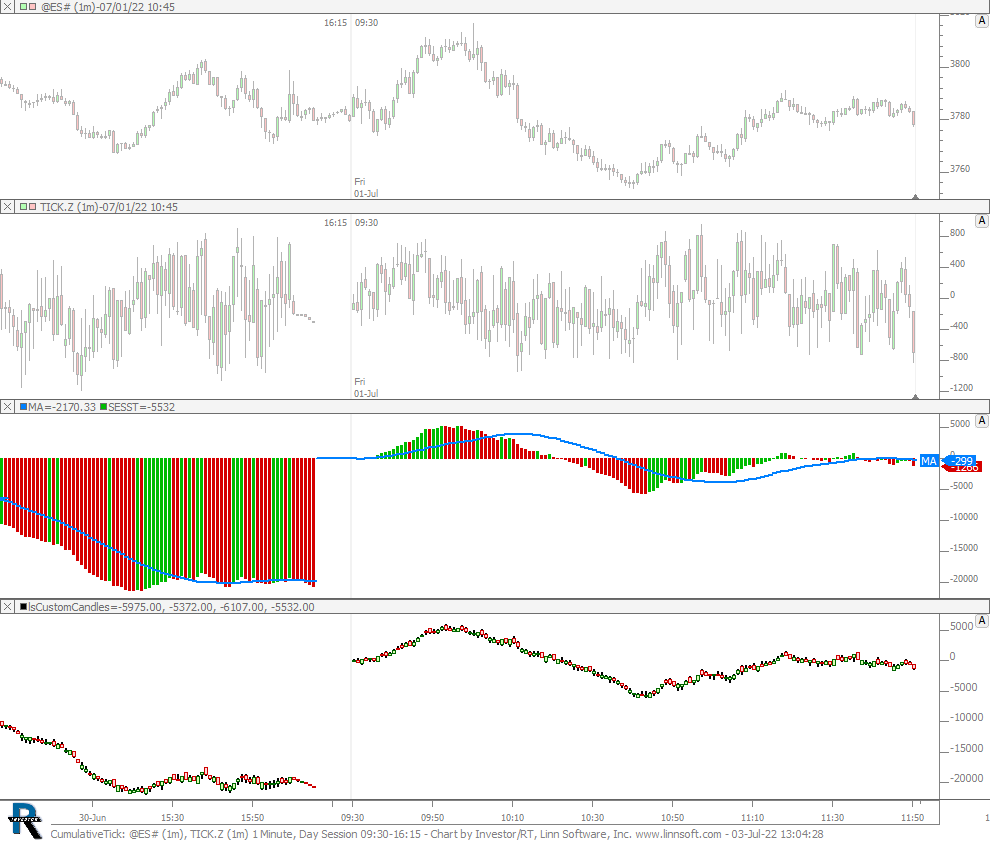 |
CumulativeTick (@ES#) cpayne [totalcount]
1 year 10 months ago
Cumulative Tick. This chart was uploaded by Investor/RT 12.7.1 showing symbol: @ES#. |
View |
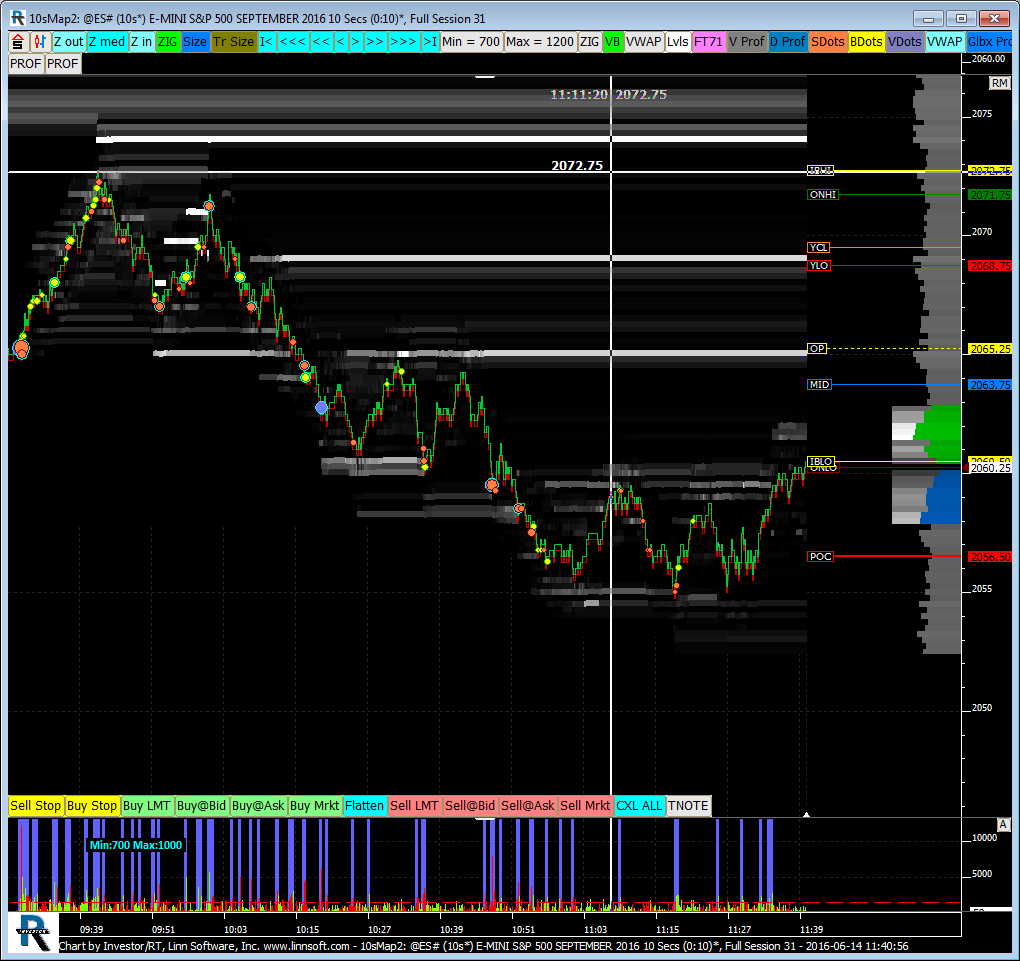 |
10sMap (@ES#) jayski51369 [totalcount]
7 years 11 months ago
This chart was uploaded by Investor/RT 12.6.1 showing symbol: @ES#. |
View |
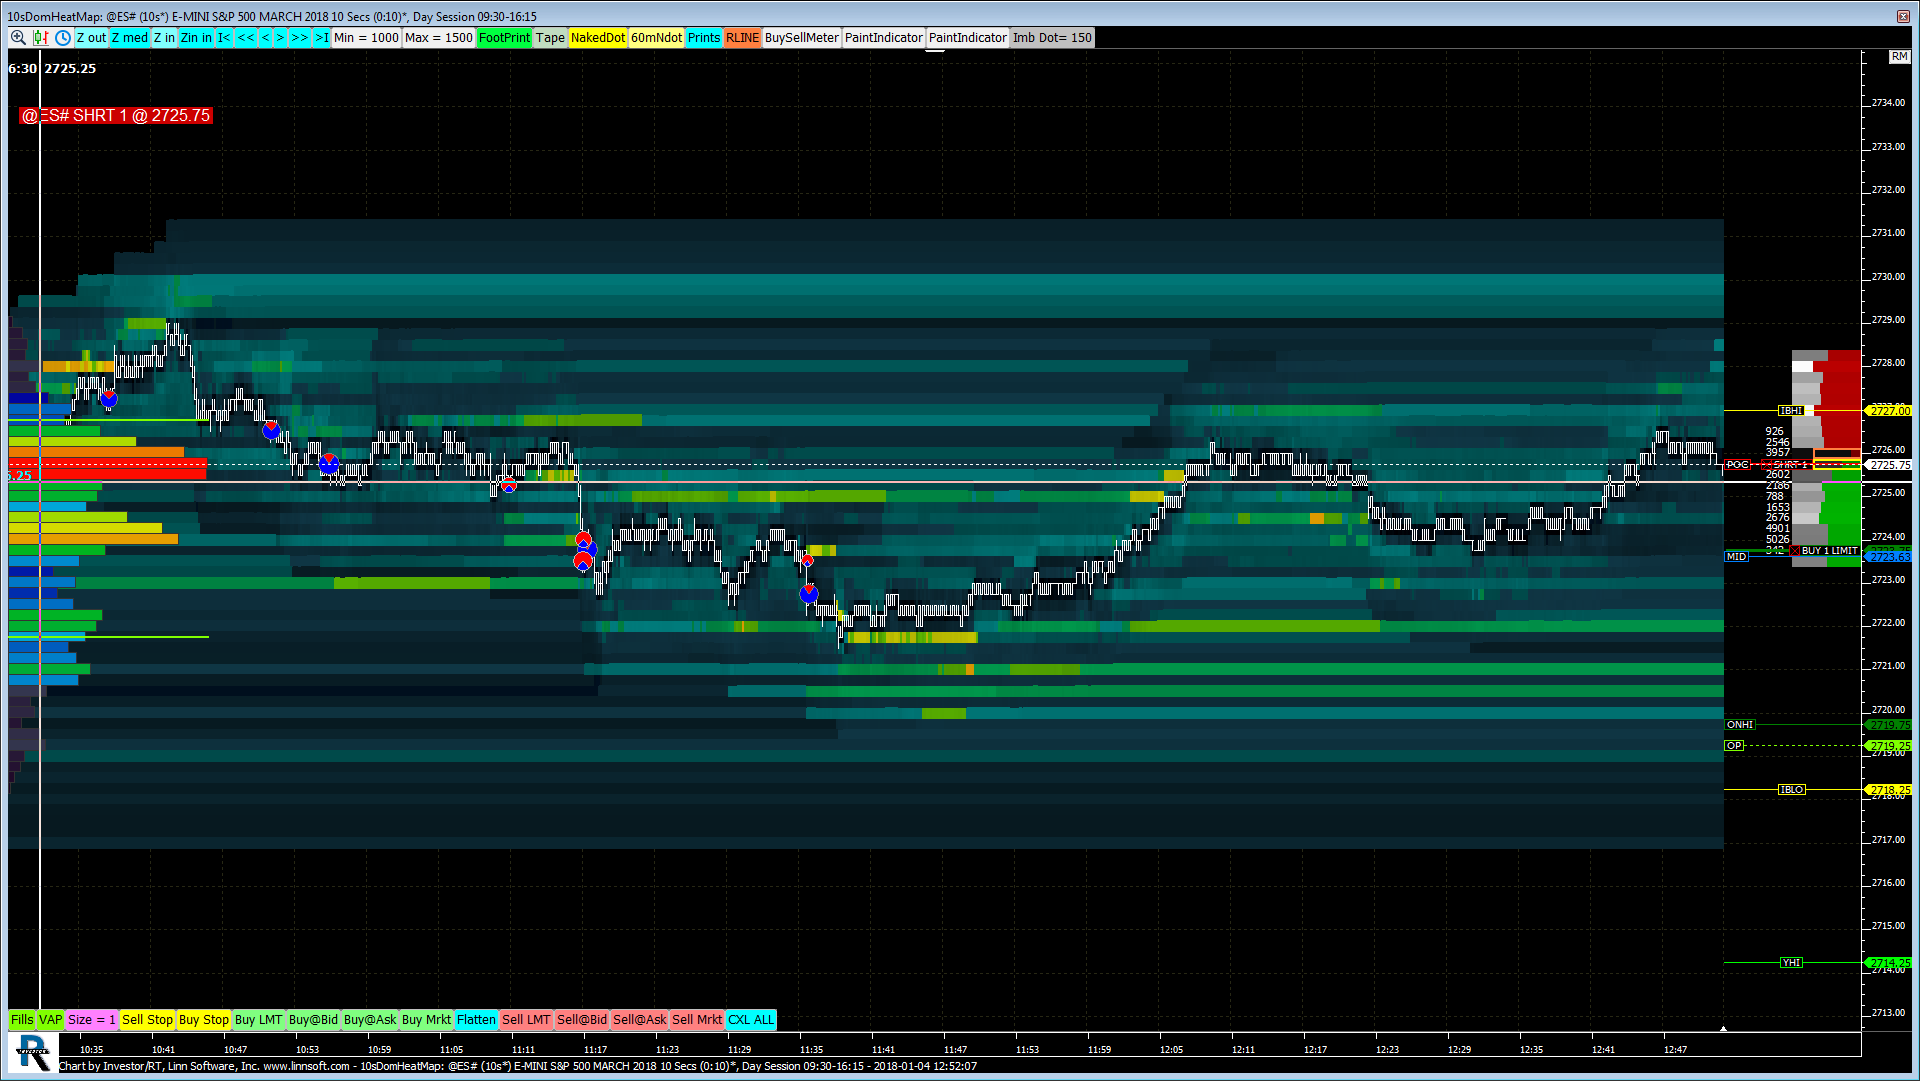 |
10sDomHeatMap (@ES#) jayski51369 [totalcount]
6 years 4 months ago
This chart was uploaded by Investor/RT 12.7.6 showing symbol: @ES#. |
View |
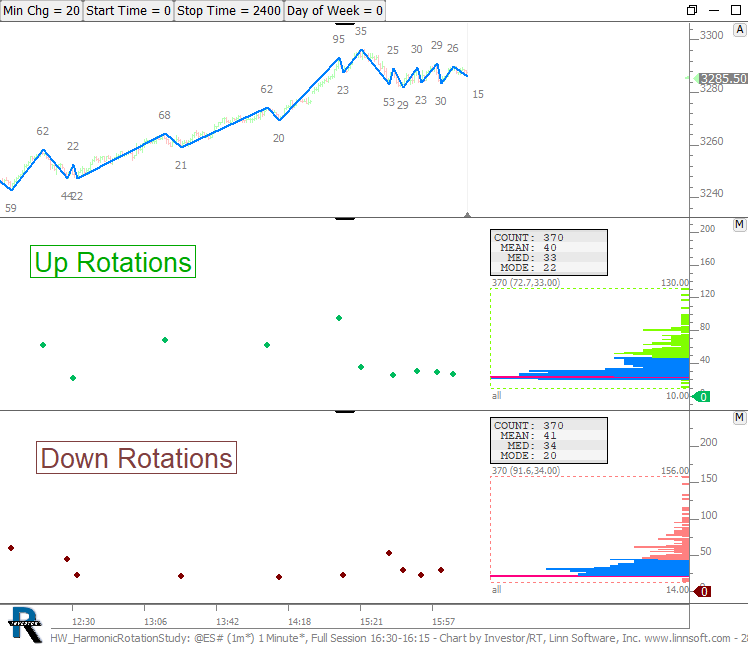 |
HW HarmonicRotationStudy (@ES#) cpayne [totalcount]
3 years 7 months ago
Harmonic Rotation Study. This chart was uploaded by Investor/RT 14.1.9 showing symbol: @ES#. |
View |
 |
Untitled (@ES#) jayski51369 [totalcount]
11 months 2 weeks ago
This chart was uploaded by Investor/RT 12.6.2 showing symbol: @ES#. |
View |
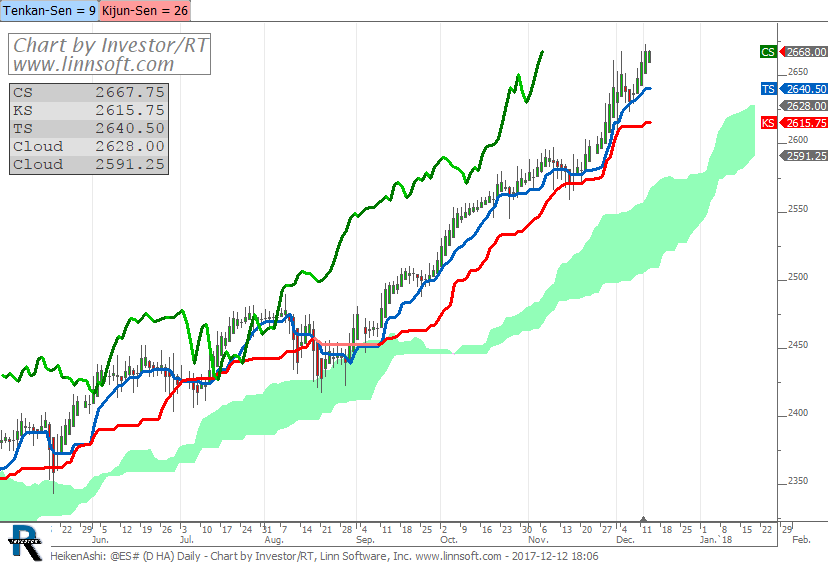 |
HeikenAshi (@ES#) cpayne [totalcount]
6 years 4 months ago
Heiken-Ashi with Ichimoku Kinko Hyo. This chart was uploaded by Investor/RT 13.1.1 showing symbol: @ES#. |
View |
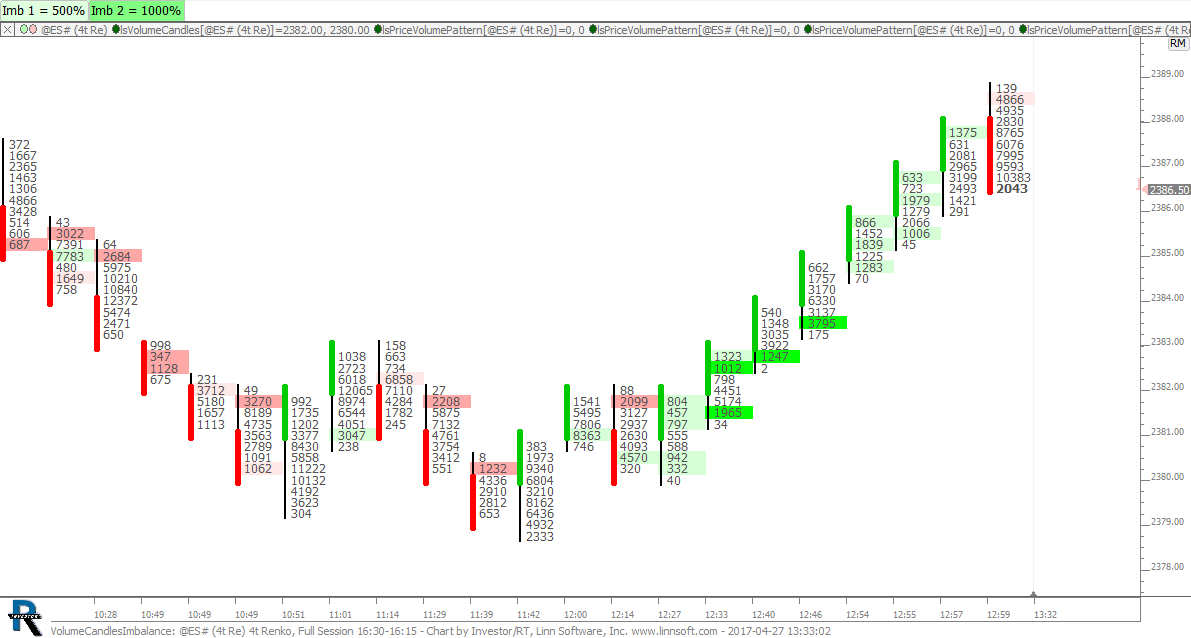 |
VolumeCandlesImbalance (@ES#) cpayne [totalcount]
7 years 1 week ago
Volume Candles with Extreme Imbalance (Controlled by Button at Top). This chart was uploaded by Investor/RT 12.7.1 showing symbol: @ES#. |
View |
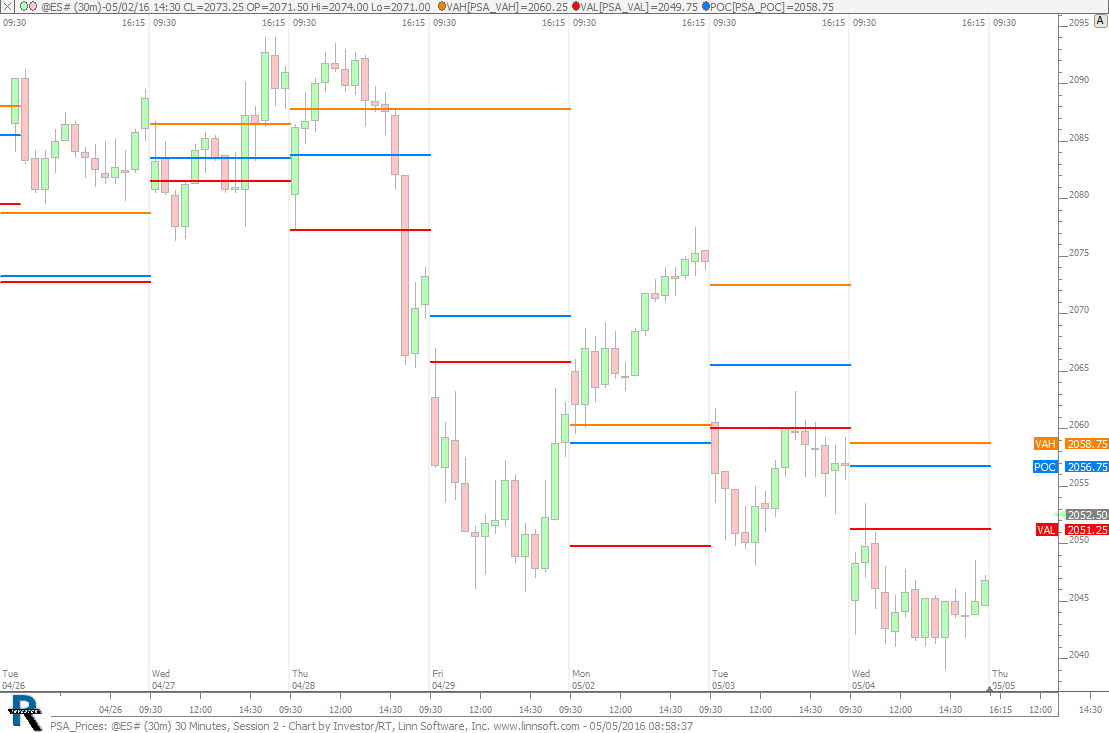 |
PSA Prices (@ES#) 2 cpayne [totalcount]
8 years 5 days ago
PSA Prices: VAH, VAL, POC. This chart was uploaded by Investor/RT 12.5.9 showing symbol: @ES#. |
View |
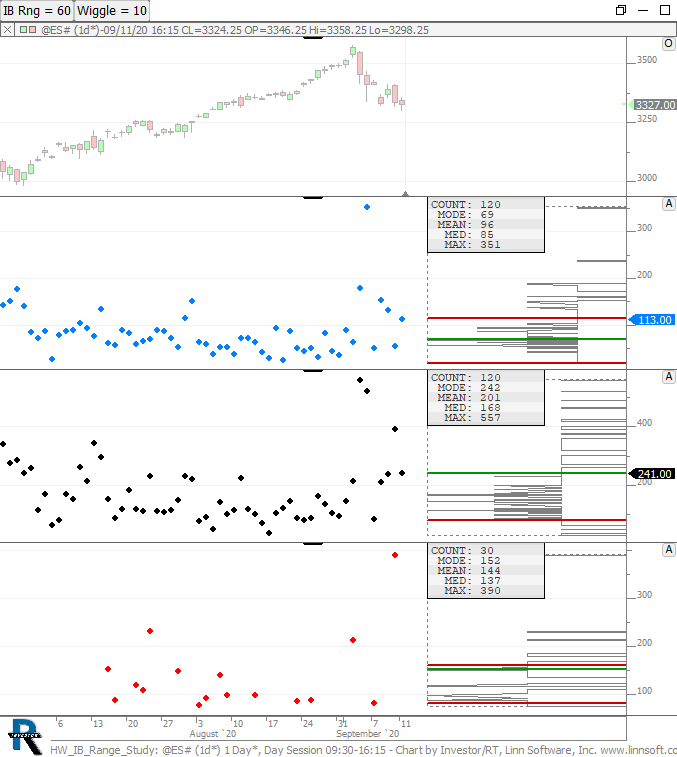 |
HW IB Range Study (@ES#) cpayne [totalcount]
3 years 7 months ago
This chart was uploaded by Investor/RT 14.1.5 showing symbol: @ES#. |
View |