 |
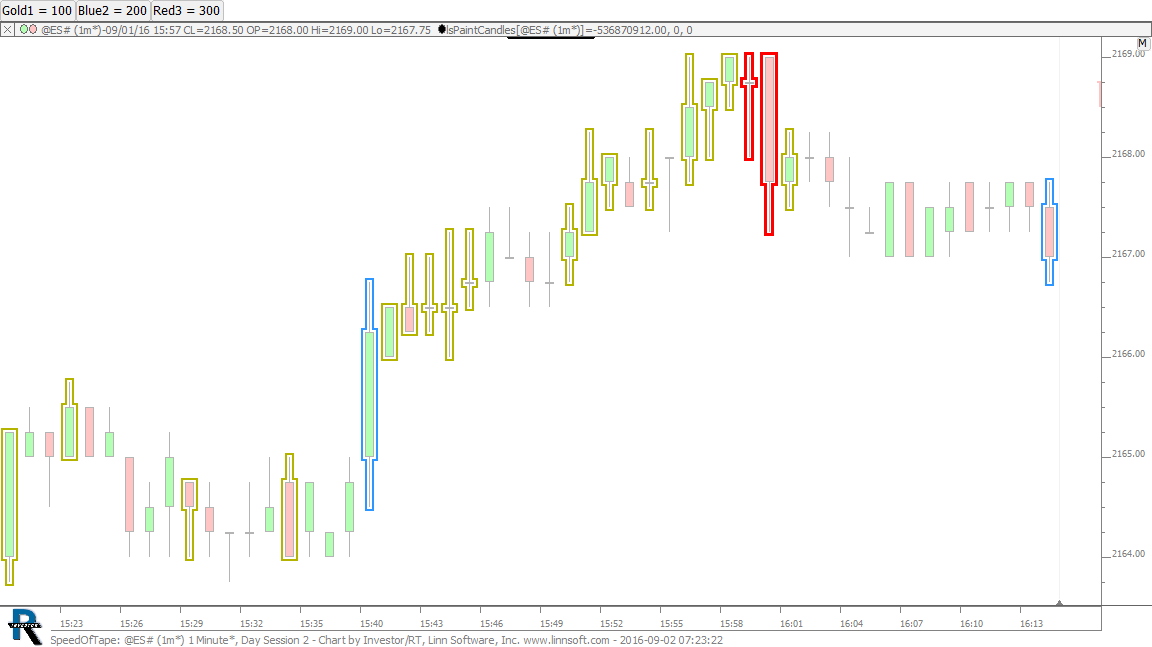
SpeedOfTape (@ES#) cpayne [totalcount]
7 years 8 months ago
Pace of Tape - PaintCandles Indicator paints bars with 150 trades or more (adjustable by button). This chart was uploaded by Investor/RT 12.6.1 showing symbol: @ES#. |
View |
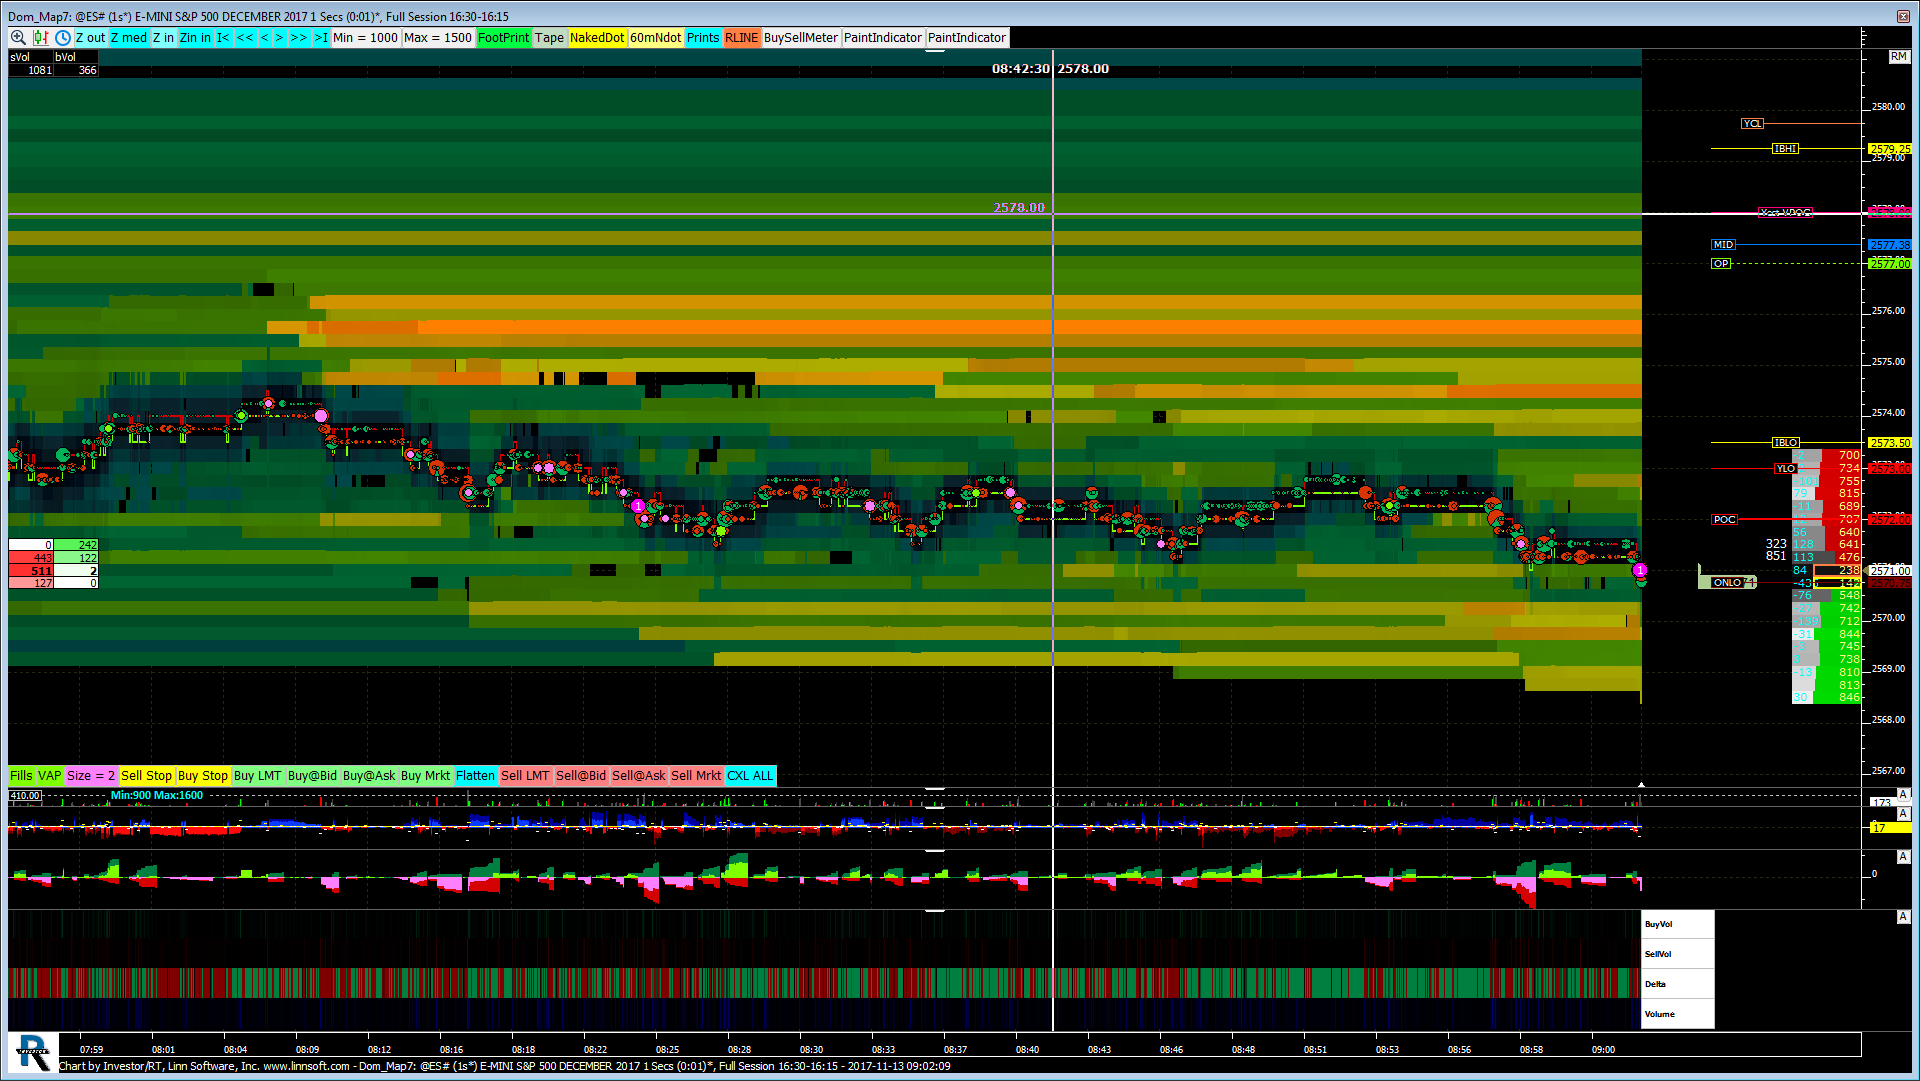 |
Dom Map (@ES#) jayski51369 [totalcount]
6 years 5 months ago
This chart was uploaded by Investor/RT 12.7.6 showing symbol: @ES#. |
View |
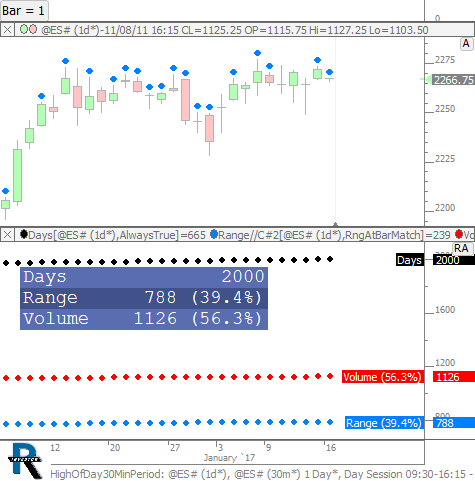 |
HighOfDay30MinPeriod (@ES#) cpayne [totalcount]
7 years 3 months ago
30 Minute Period with Max Range and Volume. This chart was uploaded by Investor/RT 12.7.1 showing symbol: @ES#. |
View |
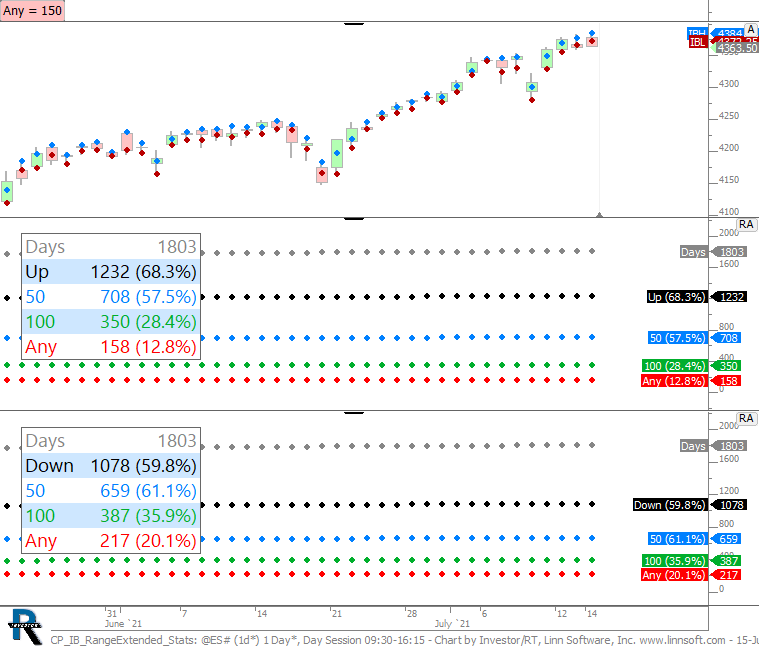 |
CP IB RangeExtended Stats (@ES#) cpayne [totalcount]
2 years 9 months ago
Percent of days IB range was extended up or down, and how often when extended up or down, it extends 50% and 100% in the same direction. Use the Any button at top to enter a custom percentage. |
View |
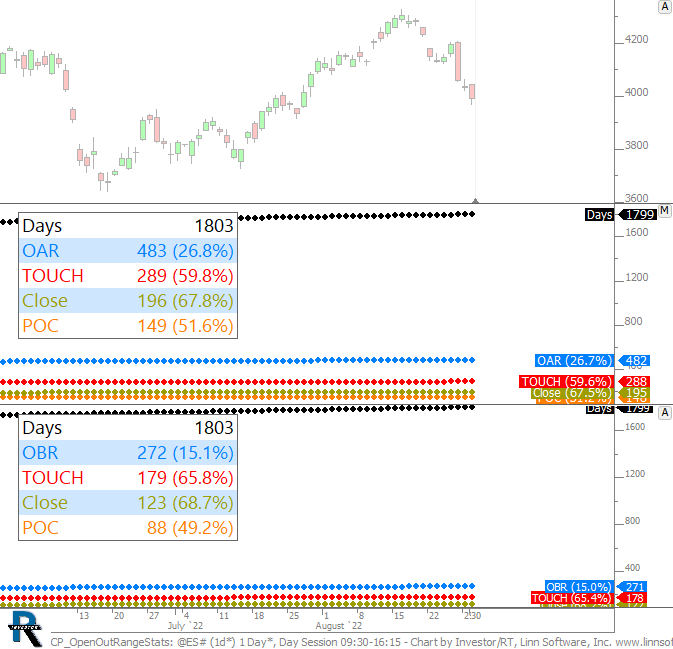 |
CP OpenOutRangeStats (@ES#) cpayne [totalcount]
1 year 8 months ago
This chart was uploaded by Investor/RT 15.1.10 showing symbol: @ES#. |
View |
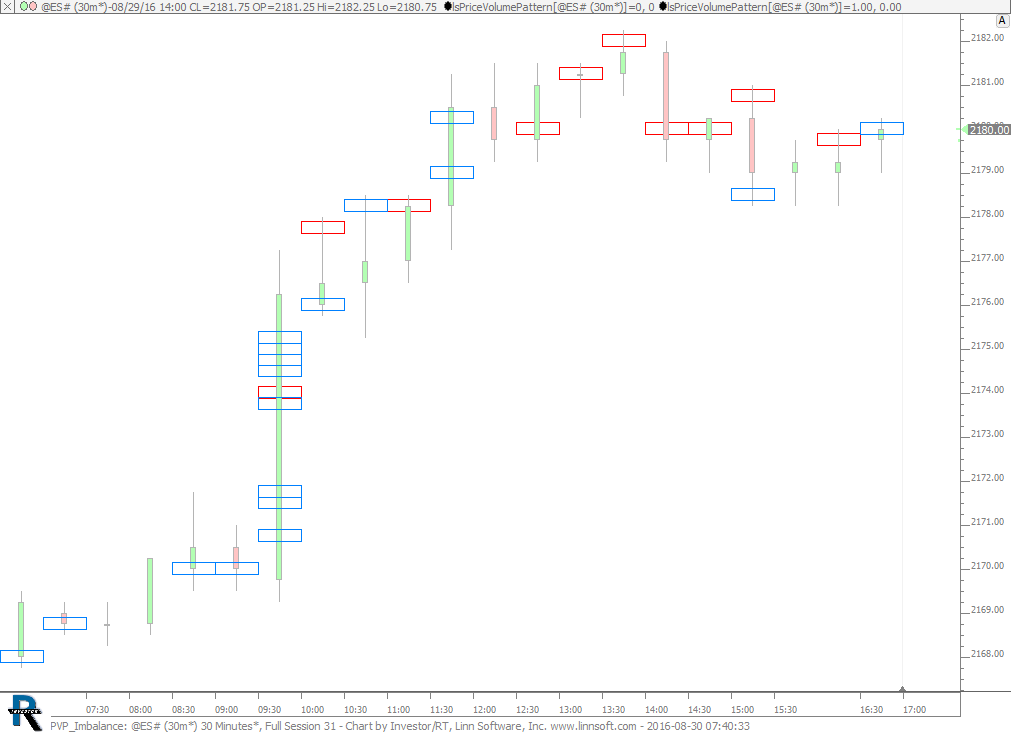 |
PVP Imbalance (@ES#) cpayne [totalcount]
7 years 8 months ago
Finding Imbalance using PVP. Blue identifies buy imbalance and red identifies sell imbalance. Requires 100 lots on both sides for imbalance to be considered. |
View |
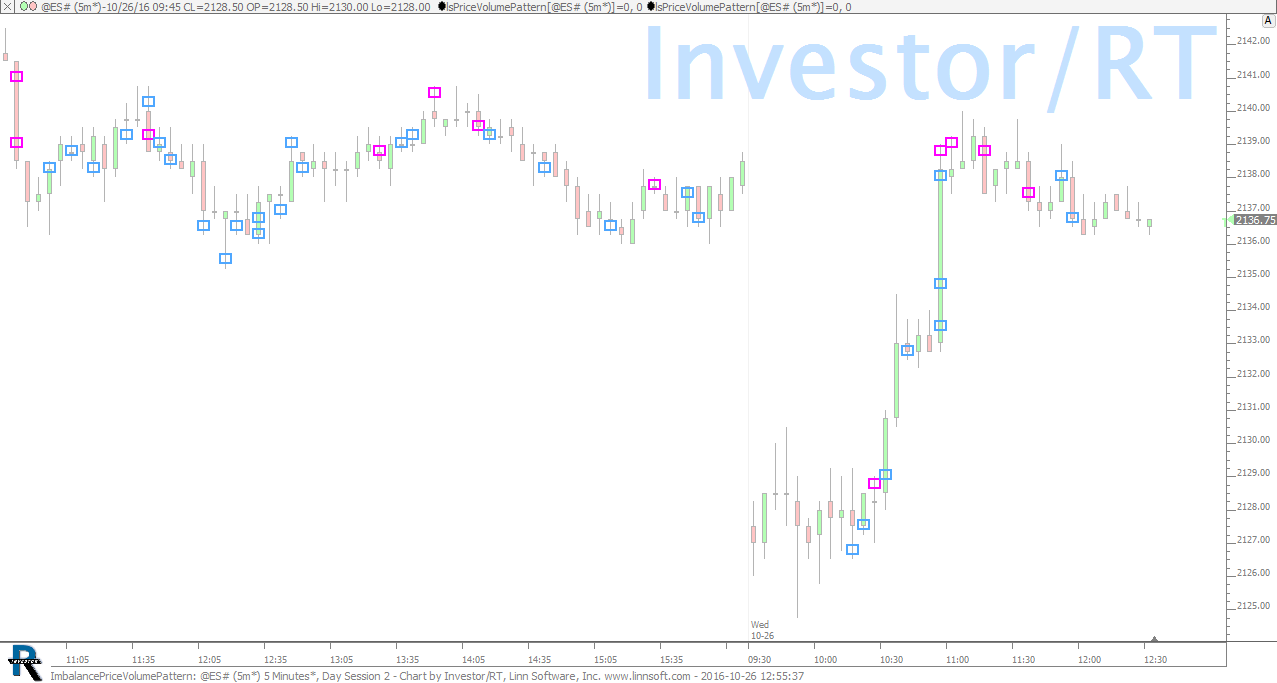 |
ImbalancePriceVolumePattern (@ES#) cpayne [totalcount]
7 years 6 months ago
Identifying Buying and Selling Volume Imbalance Using the Price Volume Pattern (PVP) RTX Indicator. |
View |
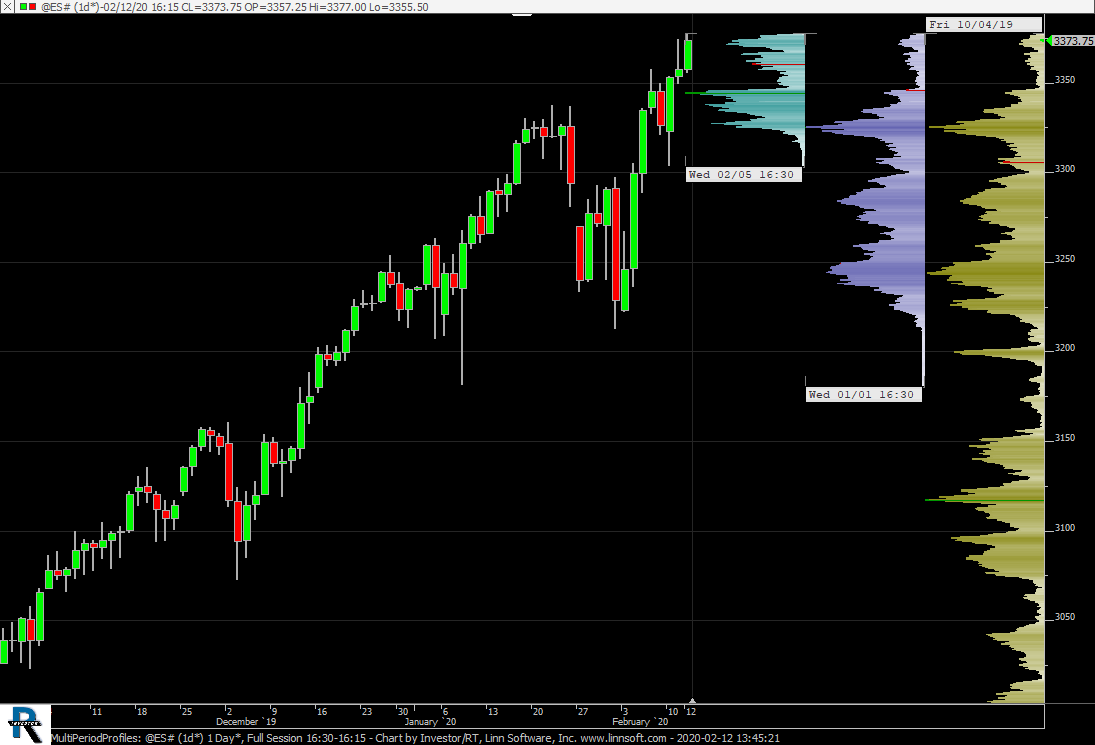 |
MultiPeriodProfiles (@ES#) cpayne [totalcount]
4 years 2 months ago
Multiple Period Overlapping Profiles. This chart is explained in the video Multiple Period Overlapping Profiles. |
View |
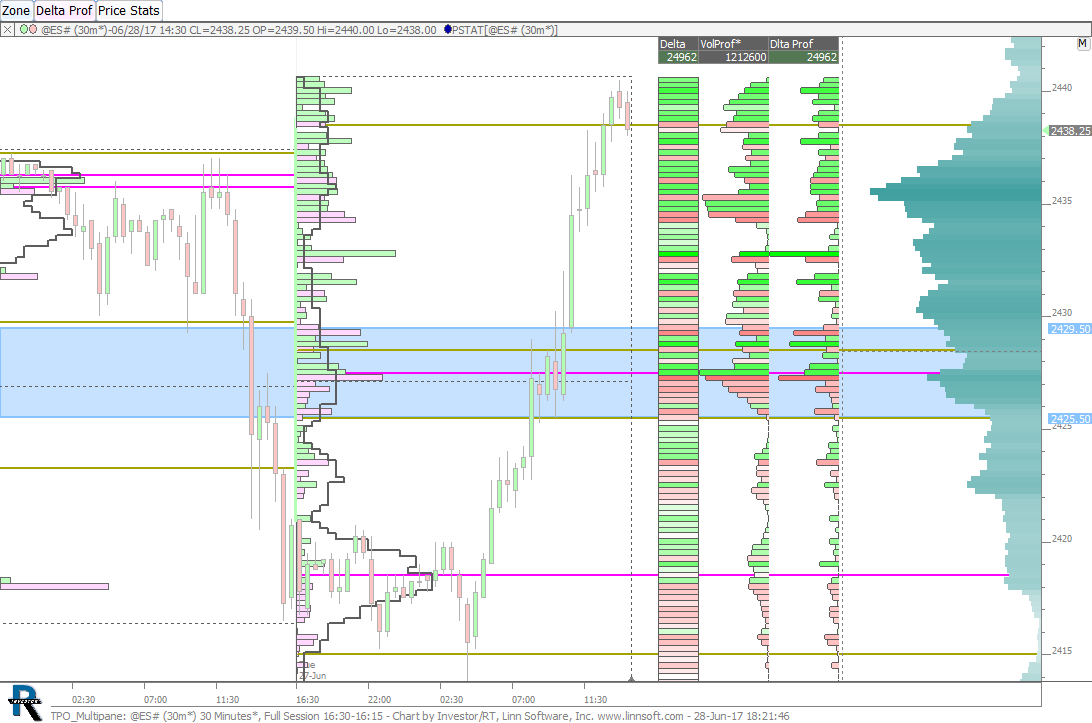 |
TPO MultiPane (@ES#) cpayne [totalcount]
6 years 10 months ago
TPO - MultiPane. This chart was uploaded by Investor/RT 12.7.2 showing symbol: @ES#. |
View |
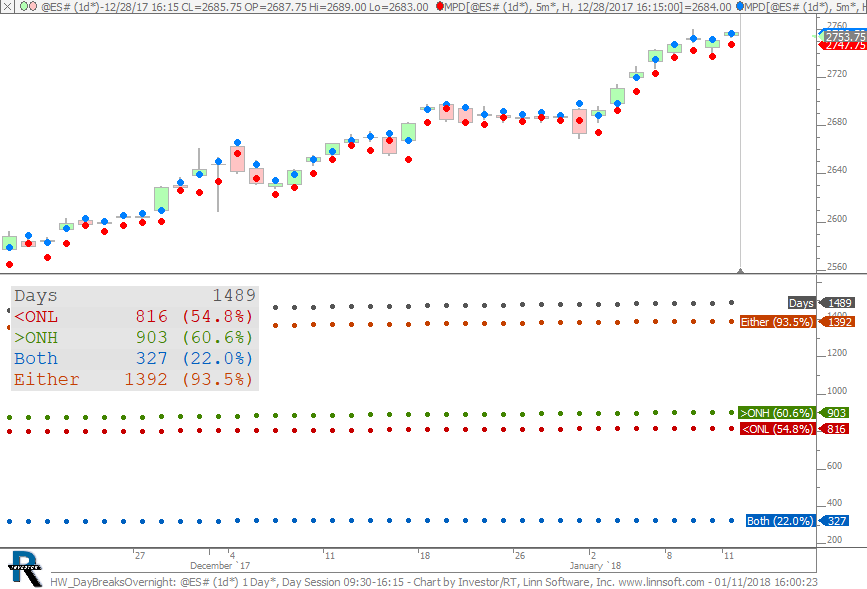 |
HW DayBreaksOvernight (@ES#) cpayne [totalcount]
6 years 3 months ago
How often is overnight high or low broken during day session. |
View |
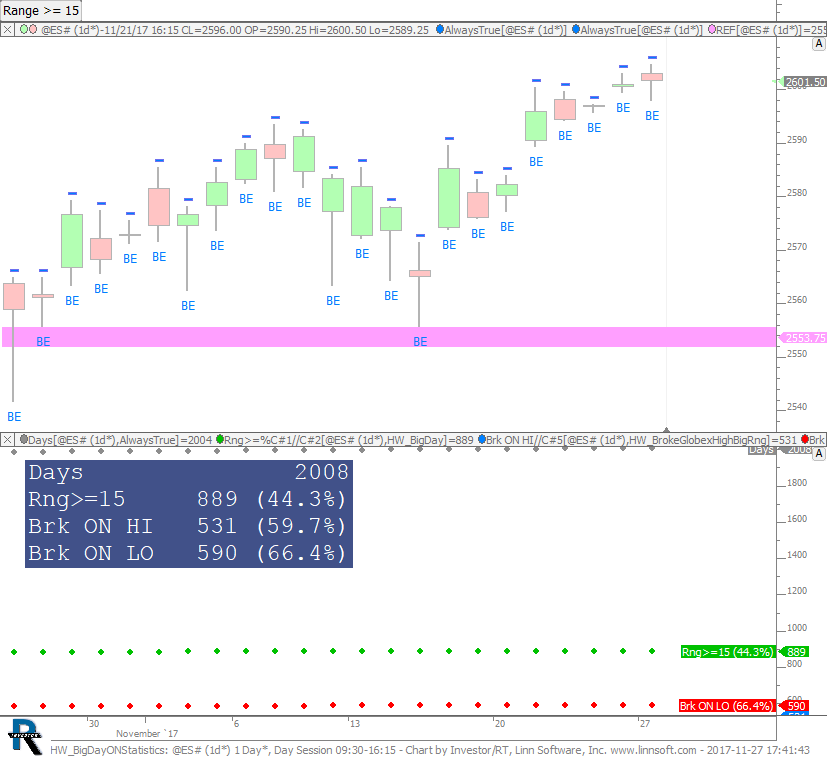 |
HW BigDayONStatistics (@ES#) cpayne [totalcount]
6 years 5 months ago
Big Range Days, and What Percent Brk Overnight High and Low. This chart was uploaded by Investor/RT 13.1.1 showing symbol: @ES#. |
View |
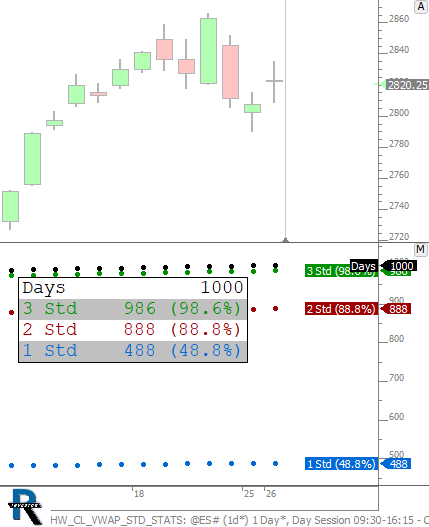 |
HW CL VWAP STD STATS (@ES#) cpayne [totalcount]
5 years 1 month ago
How often does price close within 1, 2, and 3 standard deviations of the VWAP. This chart was uploaded by Investor/RT 13.5.23 showing symbol: @ES#. |
View |
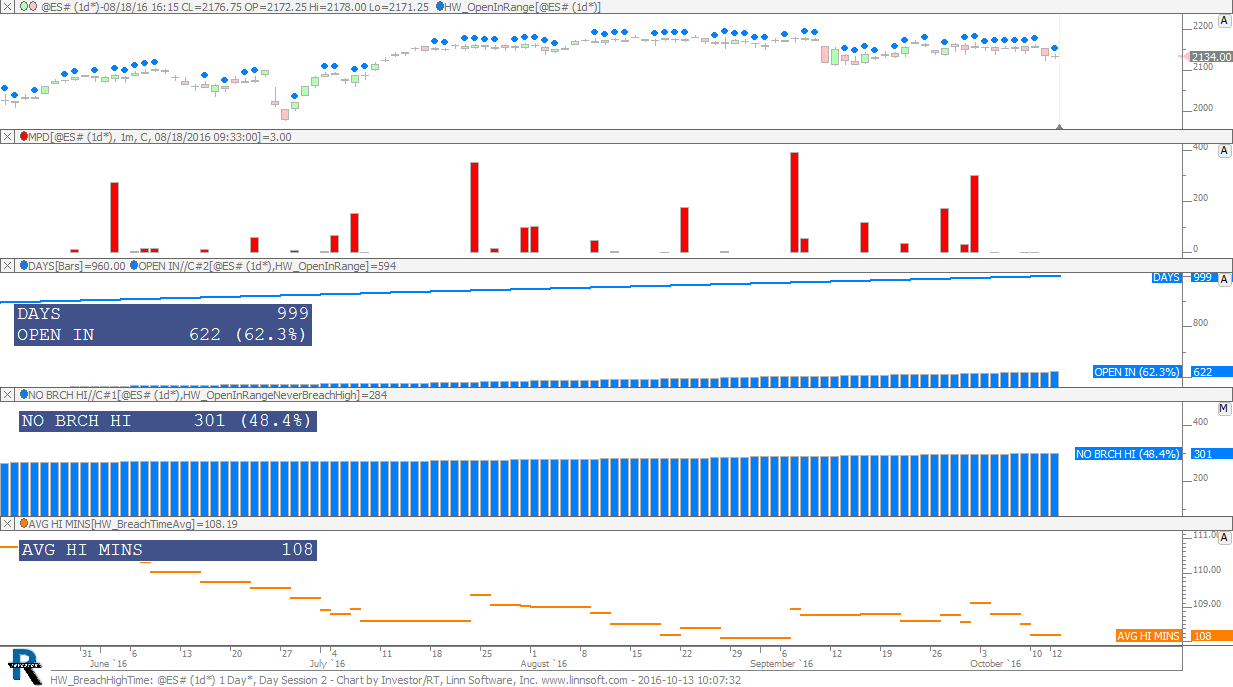 |
HW BreachHighTime (@ES#) cpayne [totalcount]
7 years 6 months ago
Homework 27: Breached Day Session High Time. |
View |
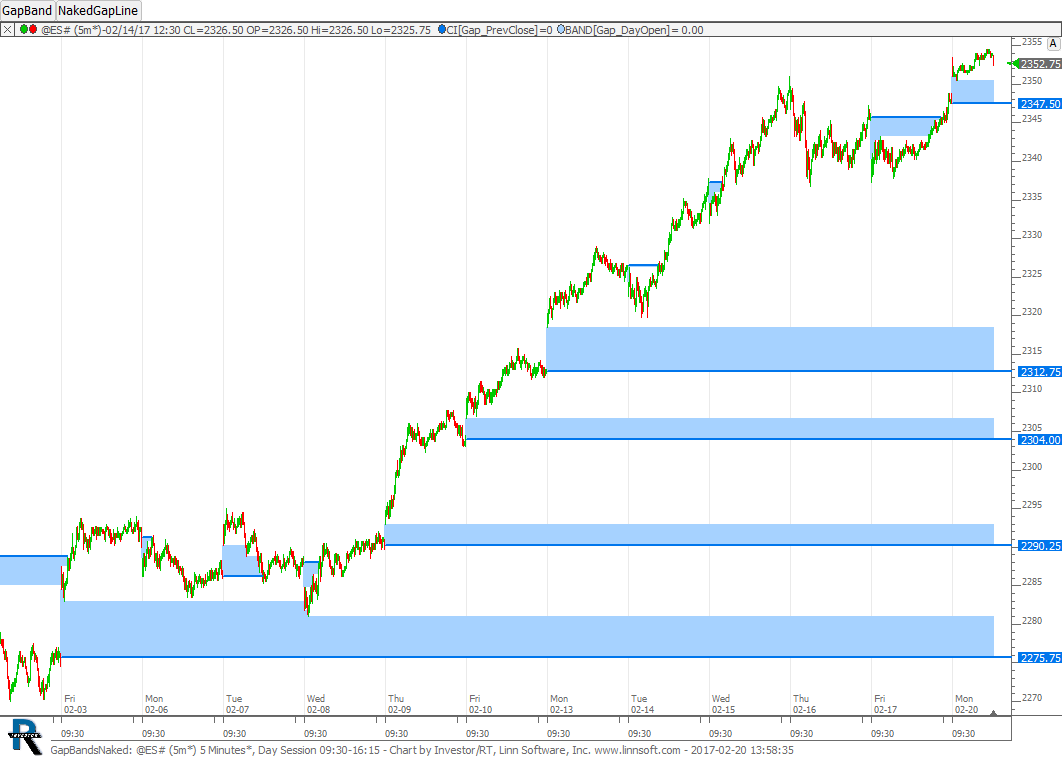 |
GapBandsNaked (@ES#) cpayne [totalcount]
7 years 2 months ago
Naked Gap Bands - Extends the gap between sessions until filled. This chart was uploaded by Investor/RT 12.7.1 showing symbol: @ES#. |
View |
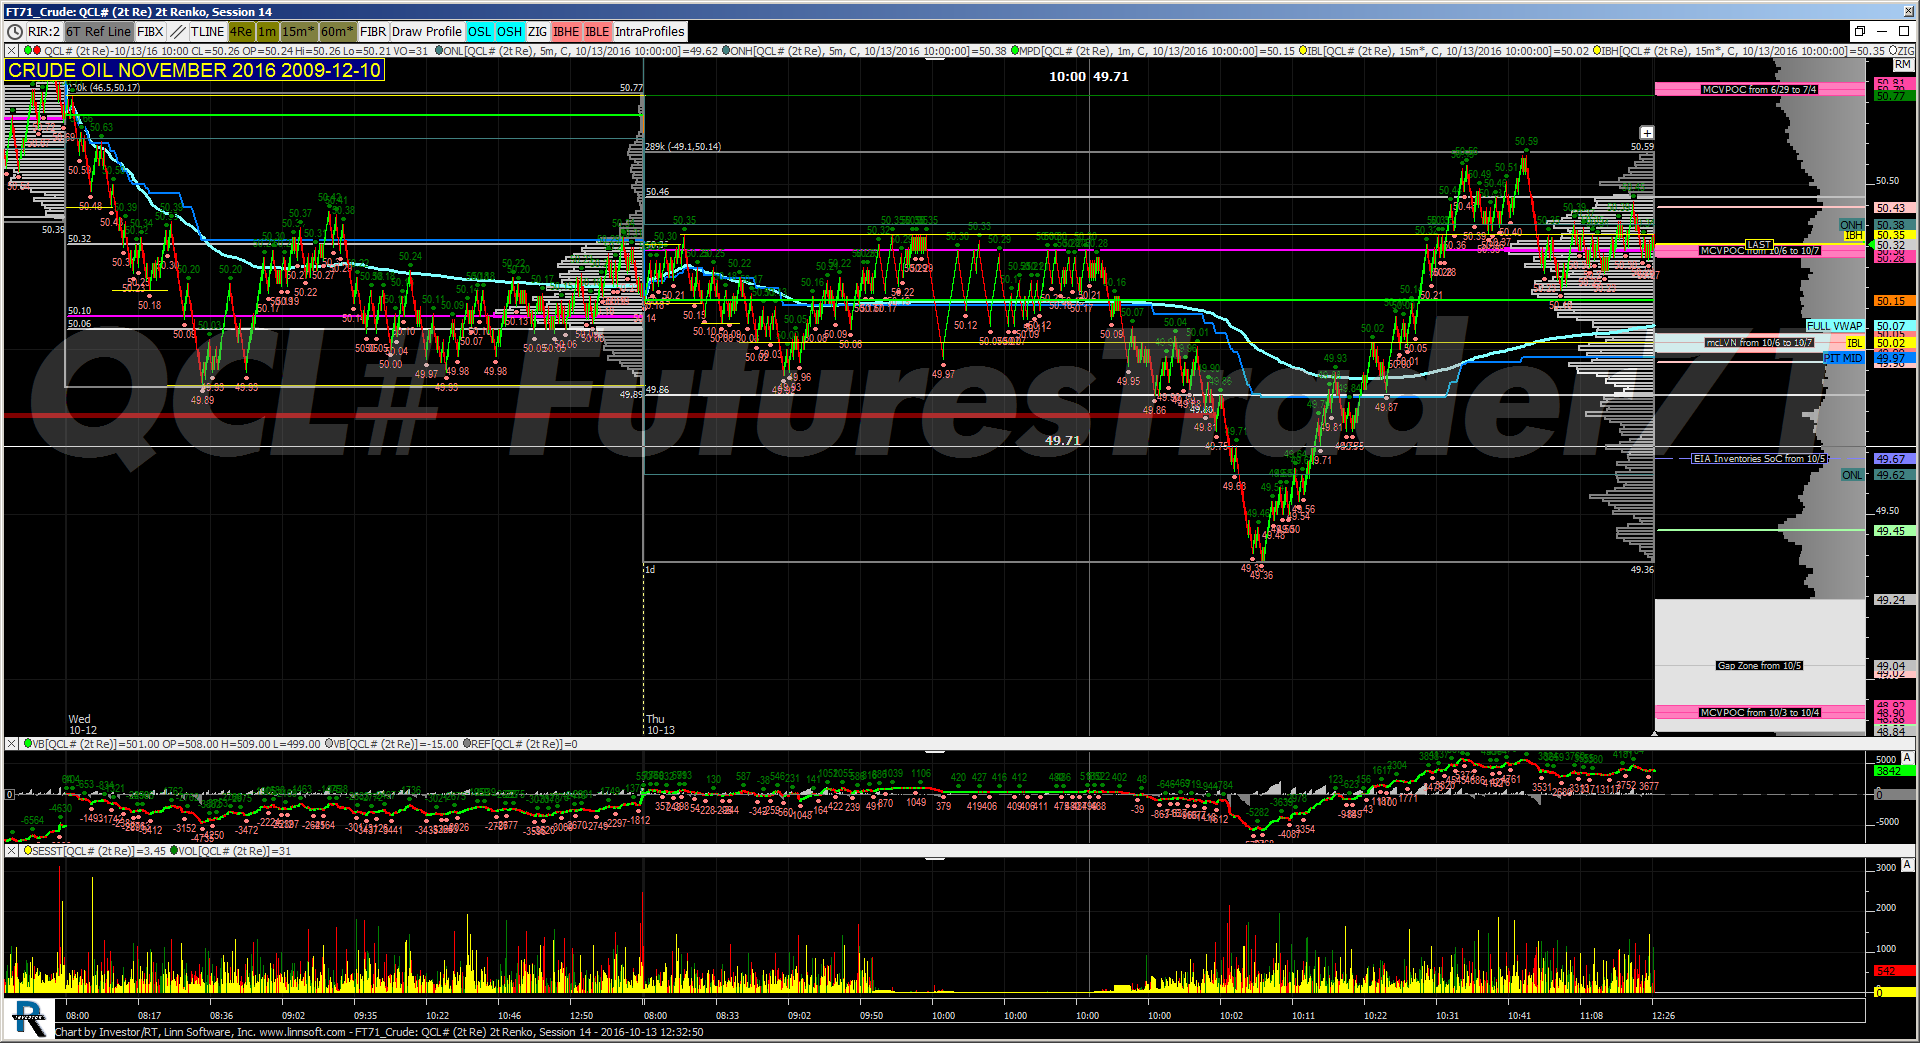 |
FT71 Crude (QCL#) futurestrader71 [totalcount]
7 years 6 months ago
Latest Crude definition for FT71. This chart was uploaded by Investor/RT 12.6.5 showing symbol: QCL#. |
View |
|
|
KepplerVolumeTracker (@ES#) cpayne [totalcount]
6 years 3 months ago
Keppler Volume Tracker (KVT) in the Multiple Price Highlighter (MPH) Indicator. This chart was uploaded by Investor/RT 13.1.5 showing symbol: @ES#. |
View |
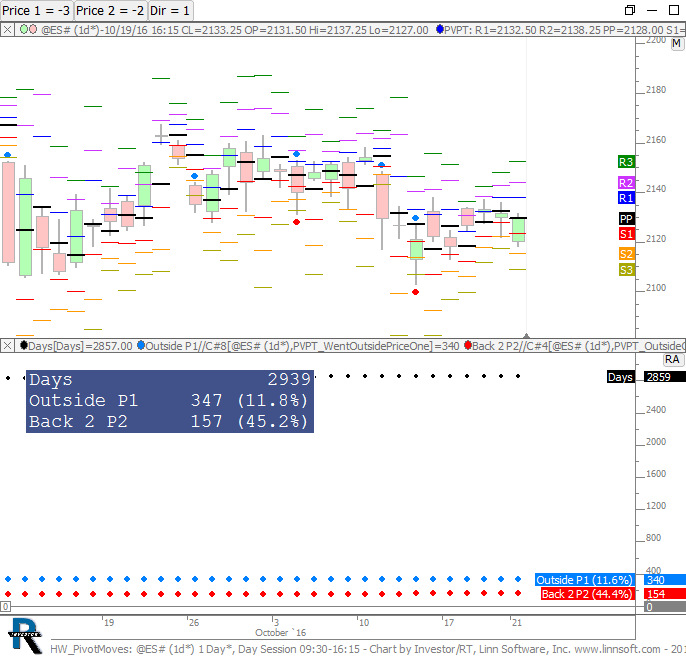 |
HW PivotMoves (@ES#) cpayne [totalcount]
7 years 2 months ago
Analyze Moves Between Any Two Pivot Levels. This chart was uploaded by Investor/RT 12.7.1 showing symbol: @ES#. |
View |
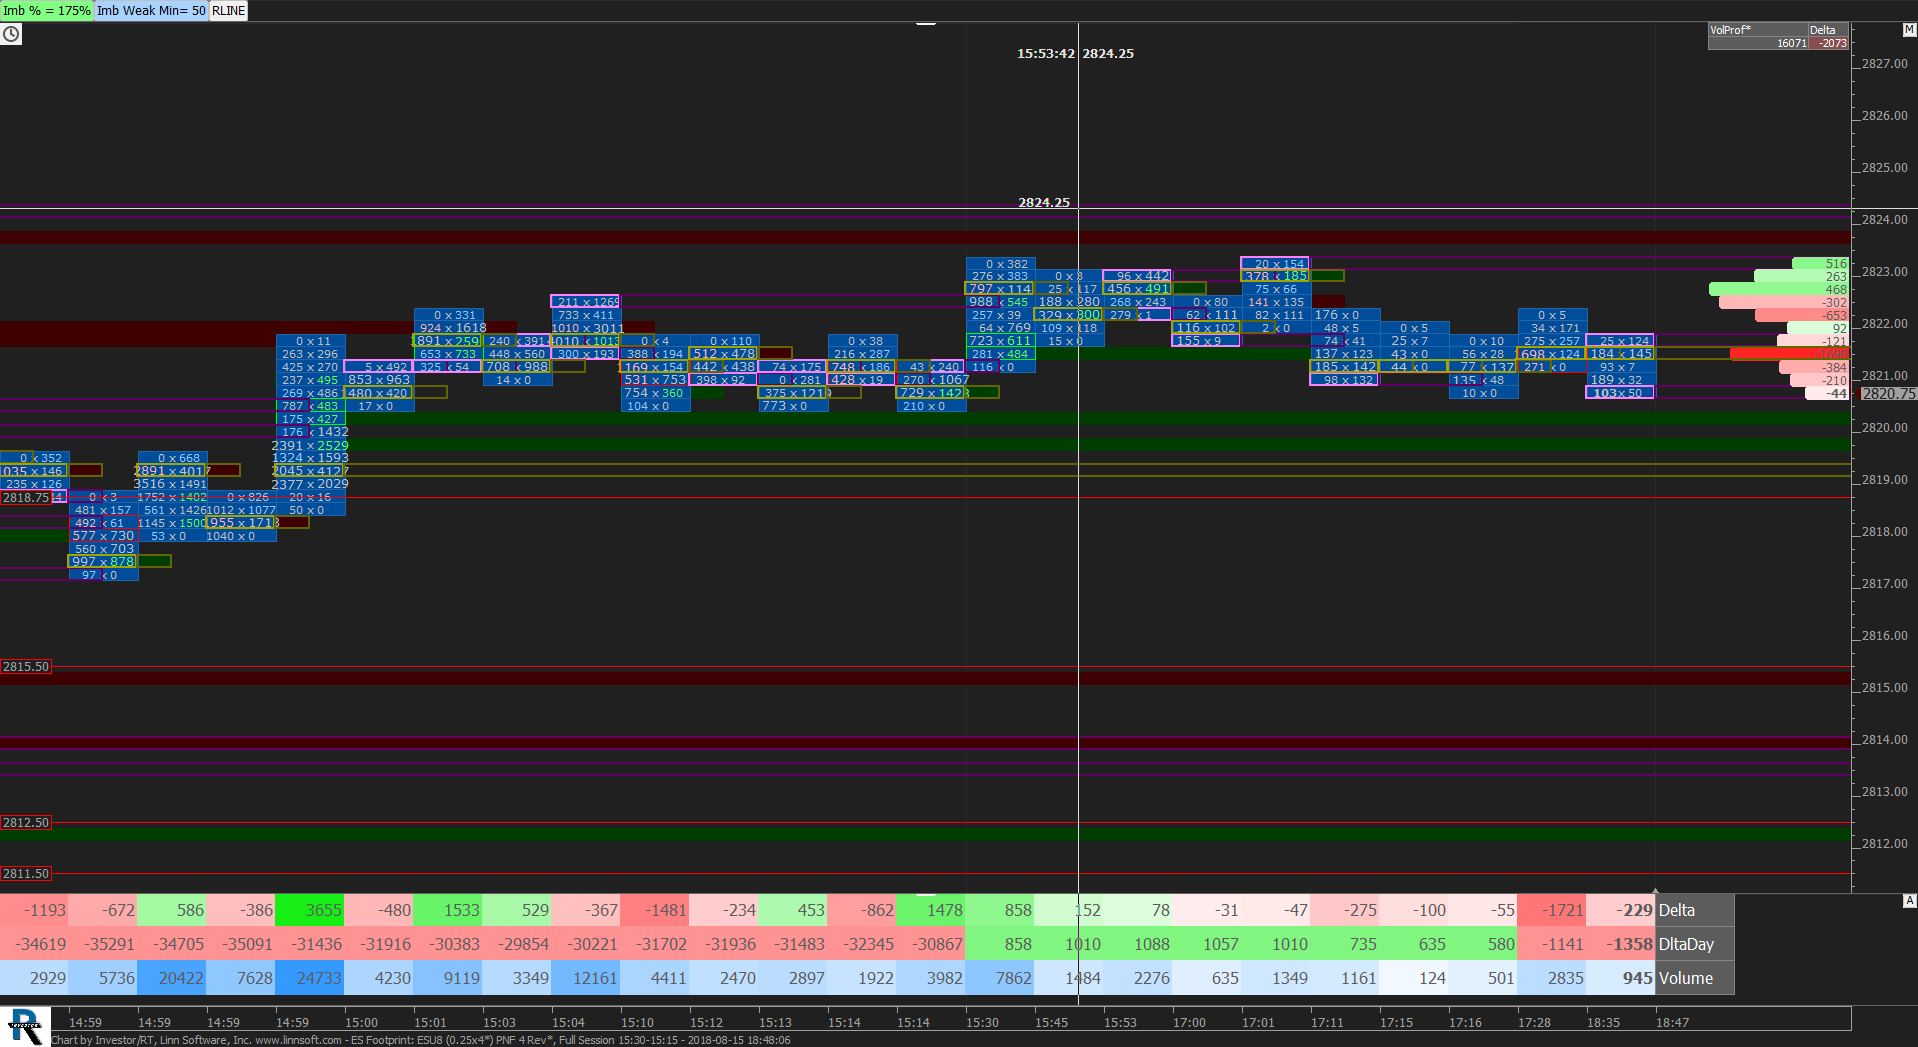 |
ES Footprint (ESU8) scottz46 [totalcount]
5 years 8 months ago
This chart was uploaded by Investor/RT 13.3.5 showing symbol: ESU8. |
View |
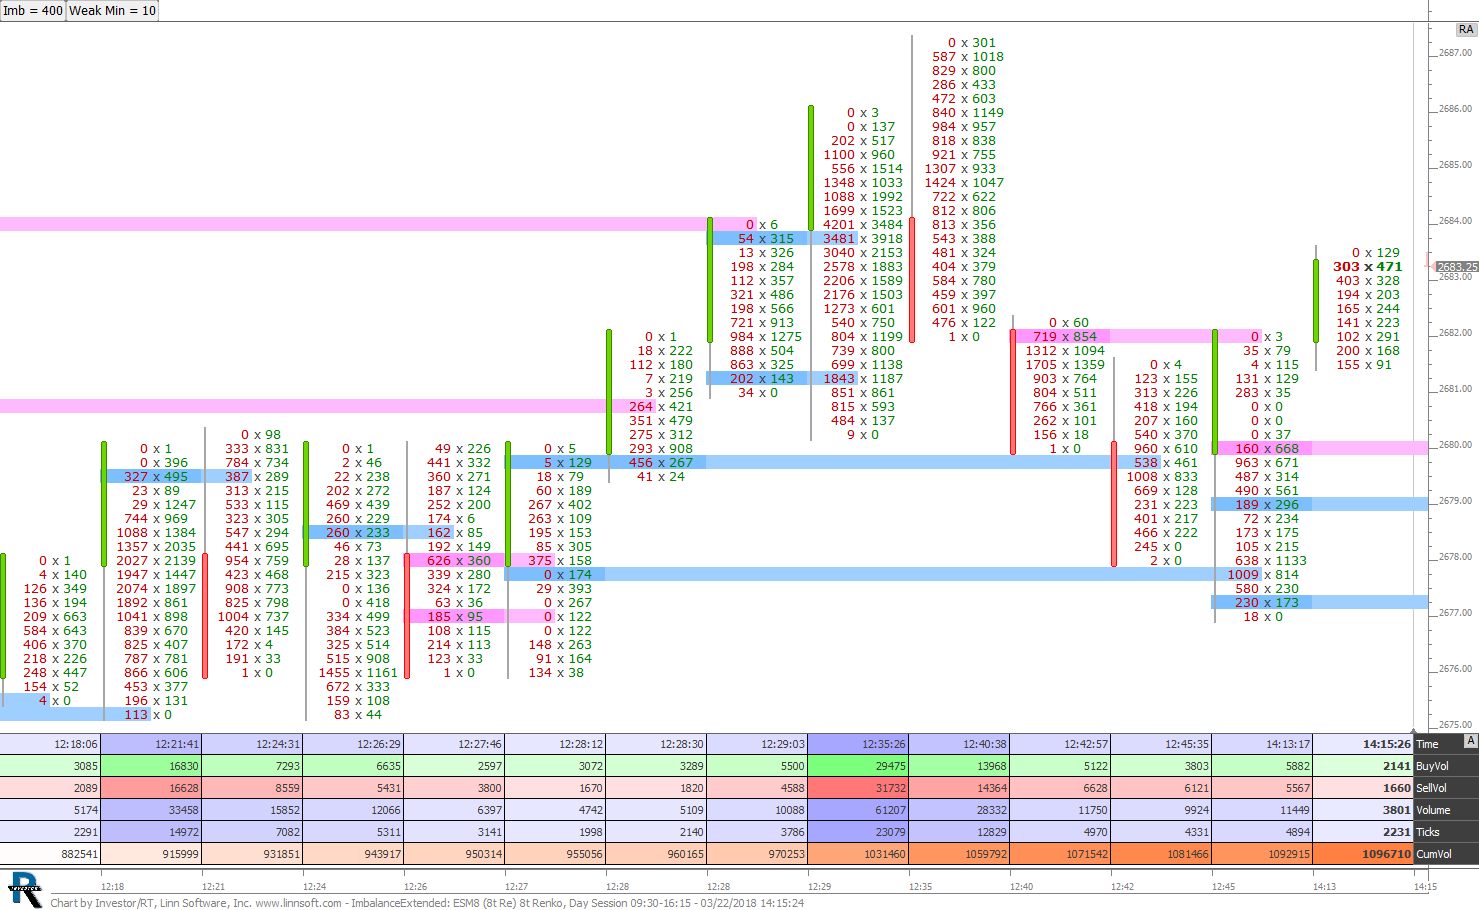 |
ImbalanceExtended (ESM8) cpayne [totalcount]
6 years 1 month ago
Buy (blue) and Sell (pink) imbalance are identified and extended while naked using MPH. The buttons at top control the imbalance percent and the minimum volume required on the weak side. |
View |
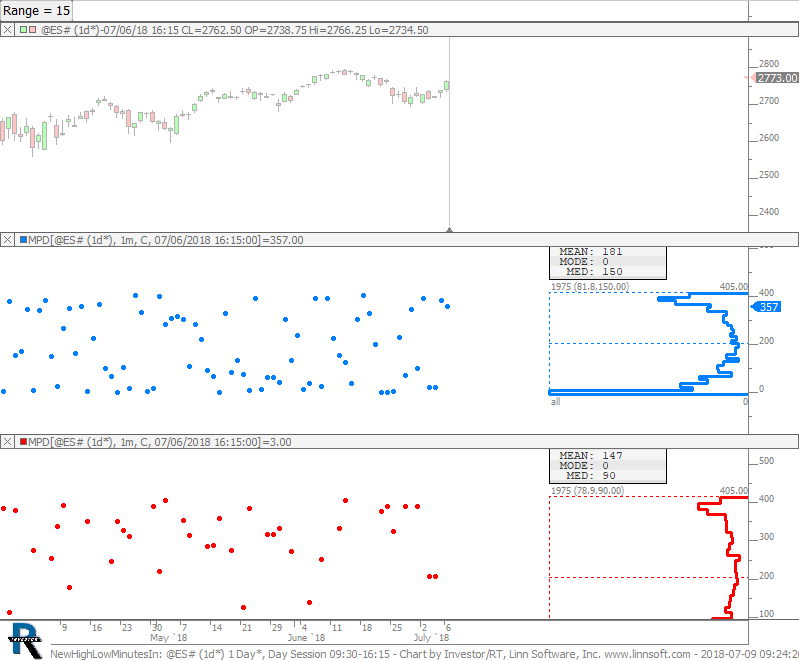 |
NewHighLowMinutesIn (@ES#) cpayne [totalcount]
5 years 10 months ago
Chart plots the time into session that high and low of day was made and then profiles those results to get Mode, Median, and Mean. |
View |
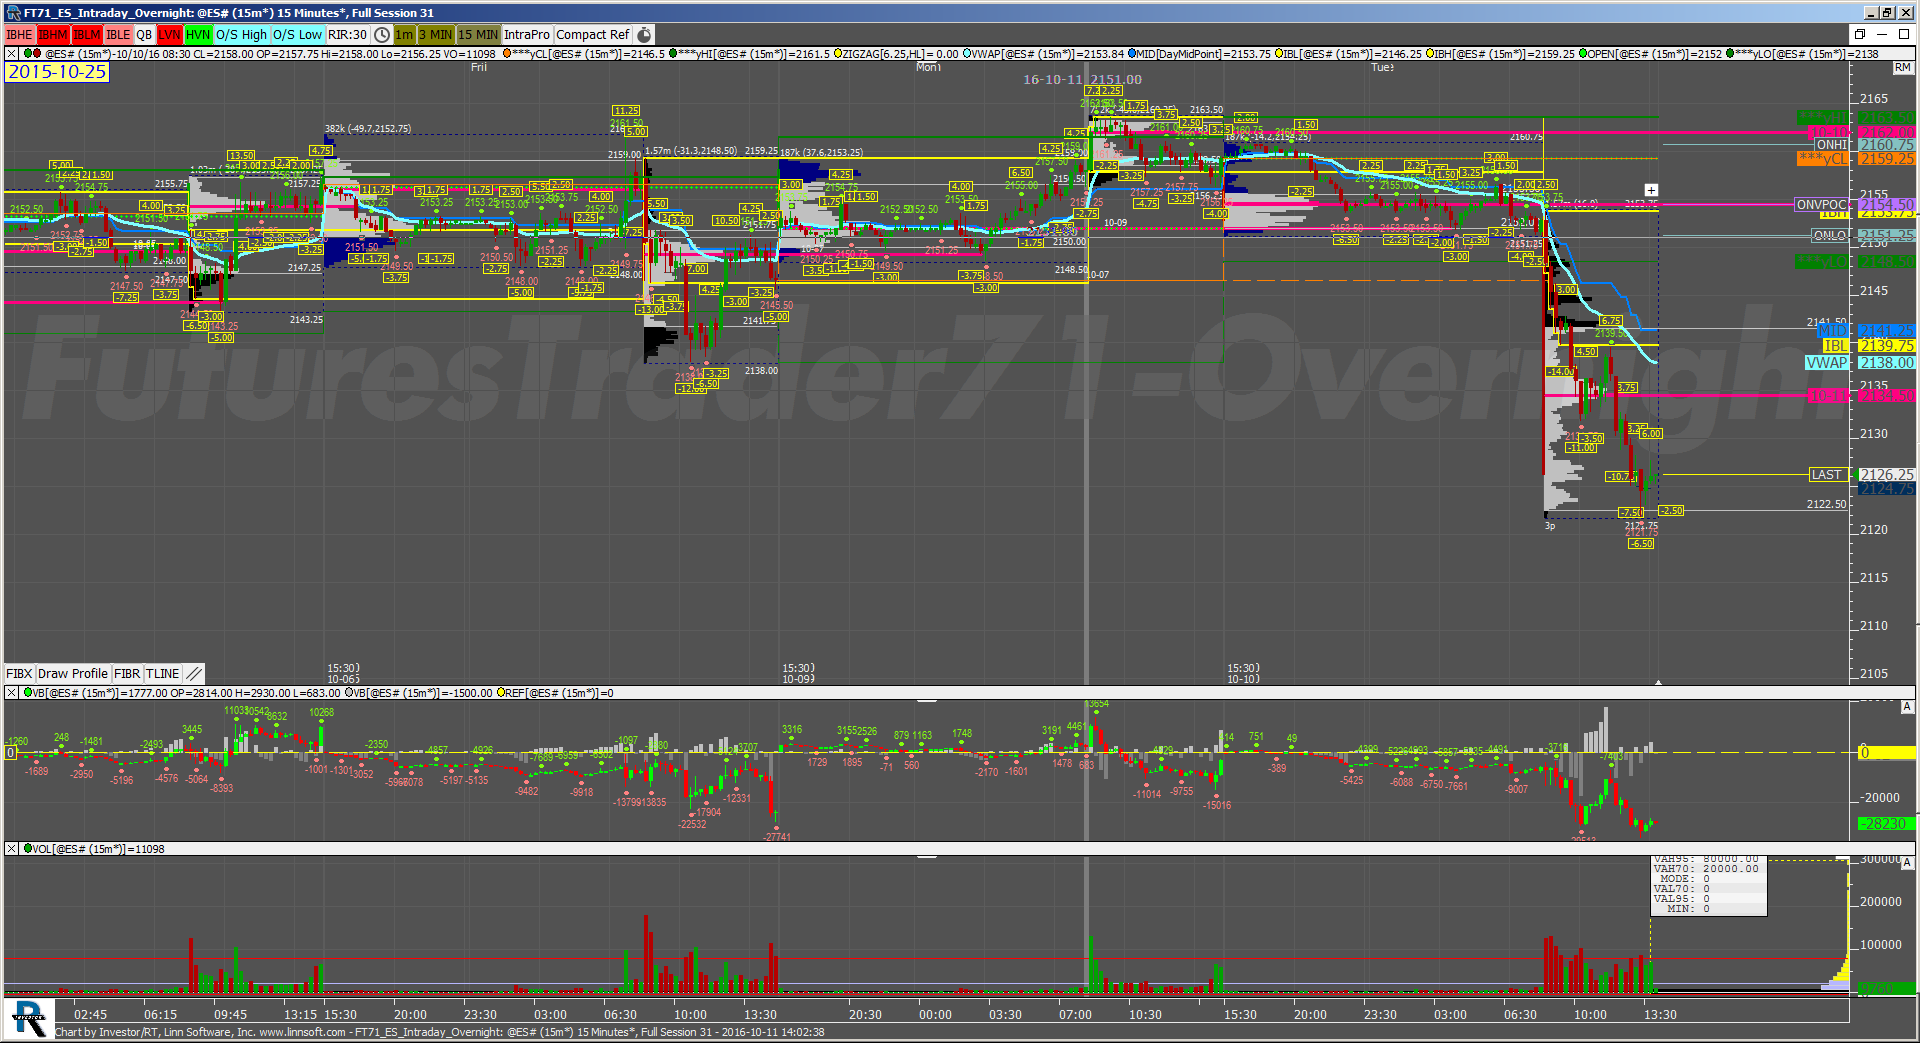 |
FT71 ES Intraday Overnight (@ES#) futurestrader71 [totalcount]
7 years 7 months ago
ES Intraday Overnight Chart as soon the Trader Bite showing both Day and Globex sessions. This chart was uploaded by Investor/RT 12.6.5 showing symbol: @ES#. |
View |
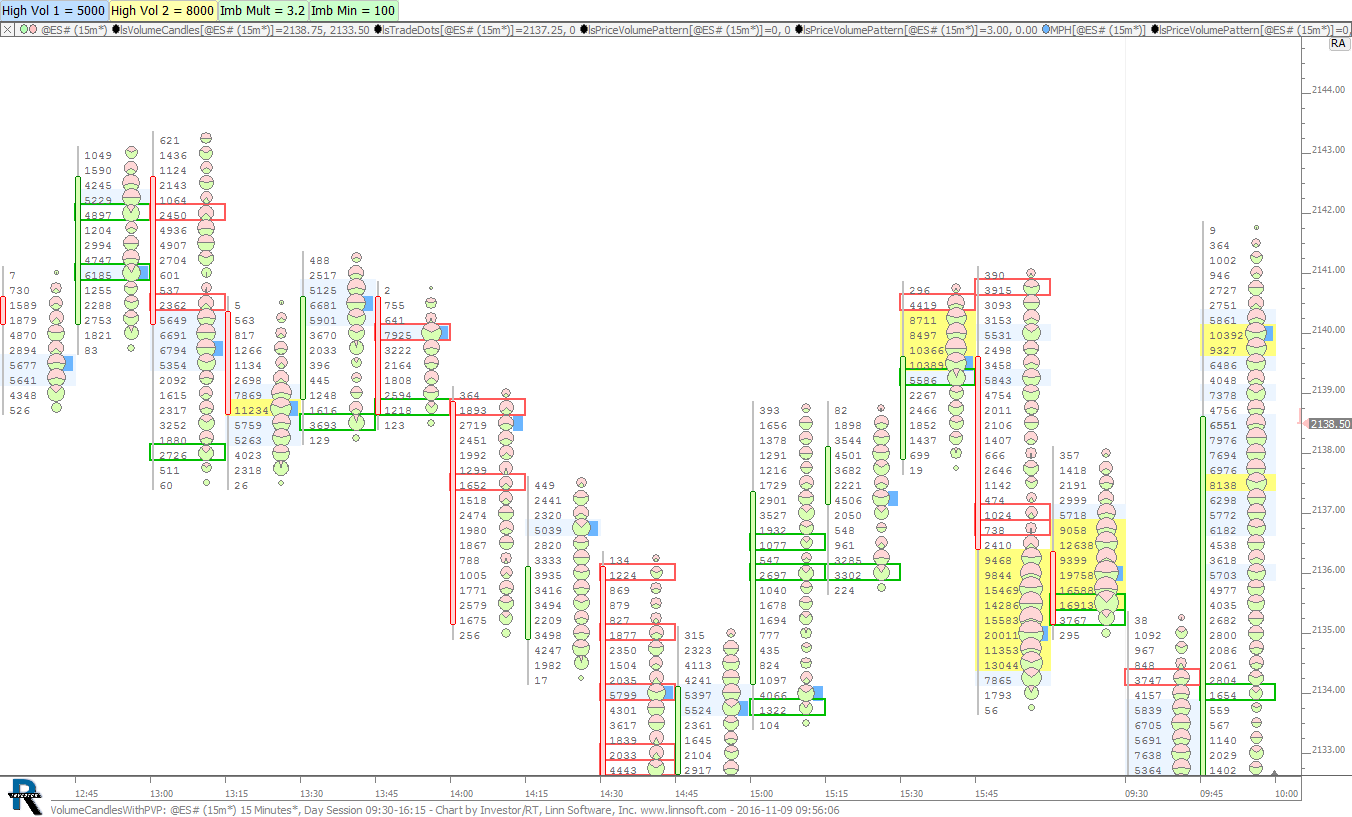 |
VolumeCandlesWithPVP (@ES#) cpayne [totalcount]
7 years 6 months ago
Volume Candles highlighting high volume prices with PVP. This chart was uploaded by Investor/RT 12.6.7 showing symbol: @ES#. |
View |
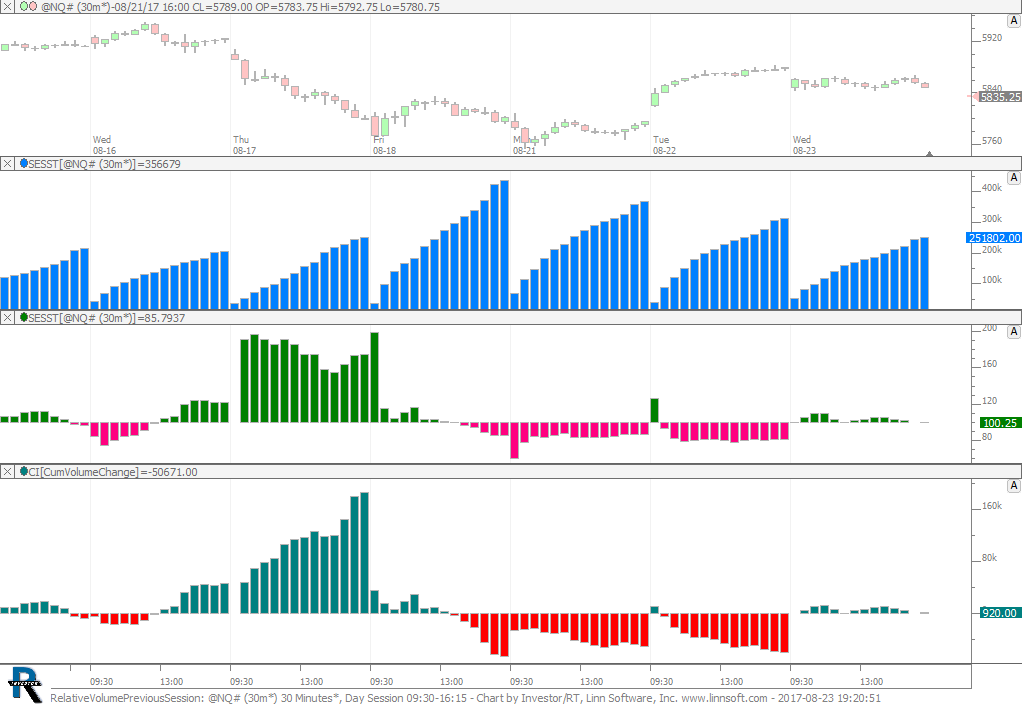 |
RelativeVolumePreviousSession (@NQ#) cpayne [totalcount]
6 years 8 months ago
Relative Volume Previous Session. This chart was uploaded by Investor/RT 12.7.7 showing symbol: @NQ#. |
View |
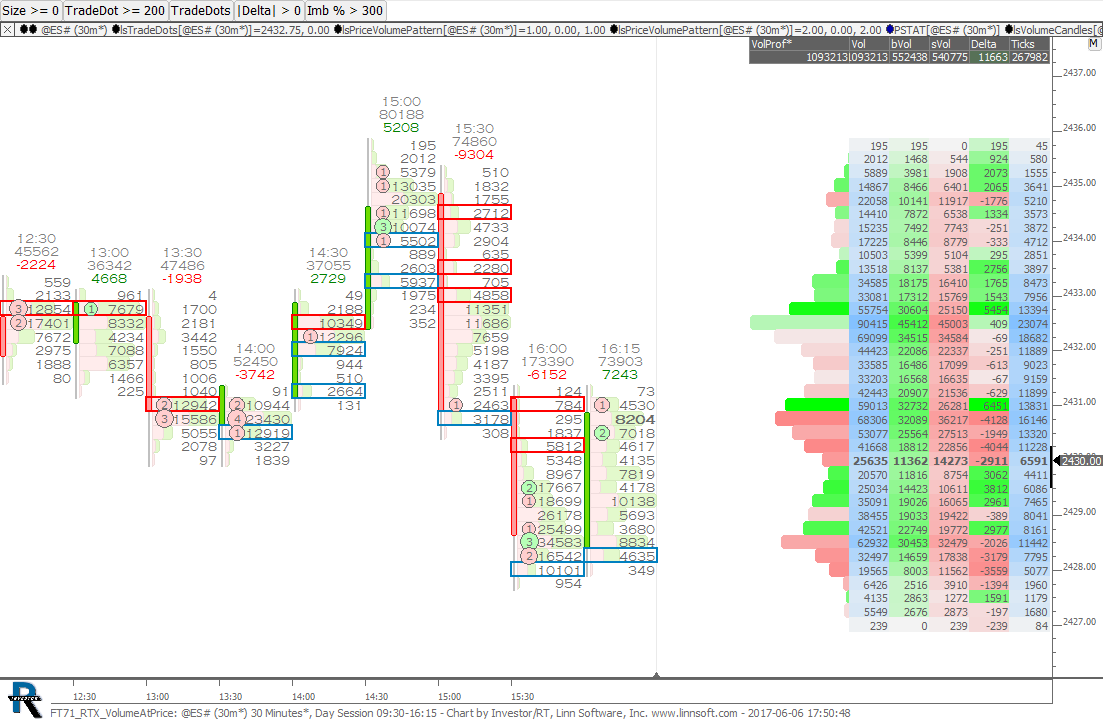 |
FT71 RTX VolumeAtPrice (@ES#) cpayne [totalcount]
6 years 11 months ago
VolumeAtPrice chart used in FuturesTrader71 Webinar on June 6, 2017. This chart was uploaded by Investor/RT 12.7.5 showing symbol: @ES#. |
View |
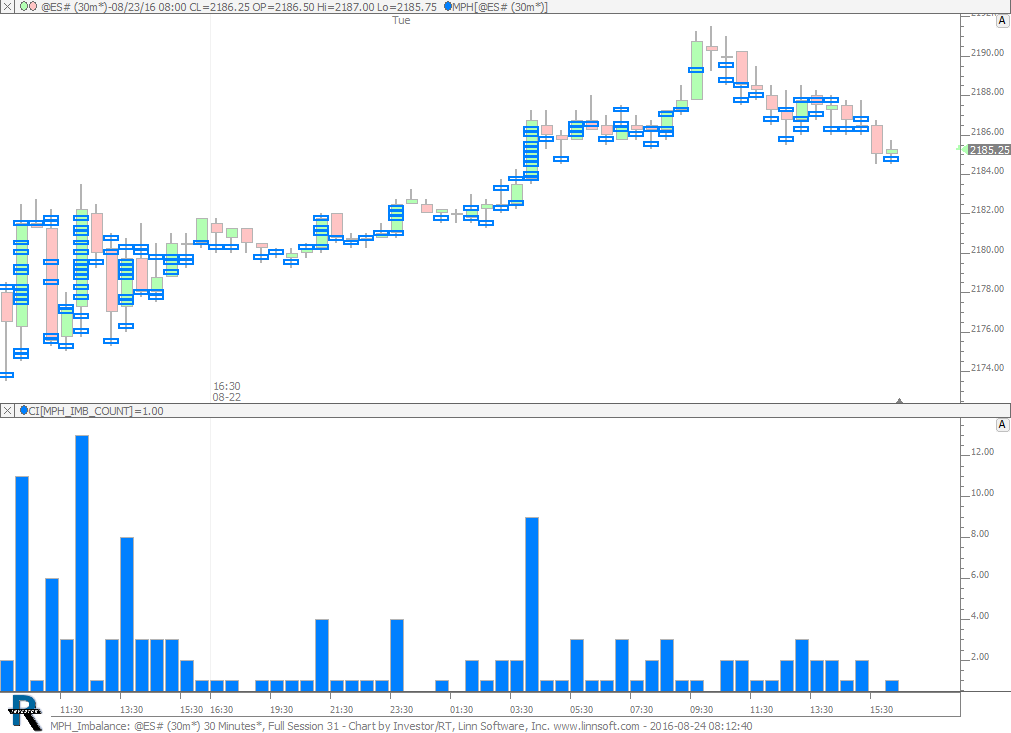 |
MPH Imbalance (@ES#) cpayne [totalcount]
7 years 8 months ago
MPH - Counting Prices with Buy Volume Imbalance > 190%. This chart was uploaded by Investor/RT 12.6.1 showing symbol: @ES#. |
View |