 |
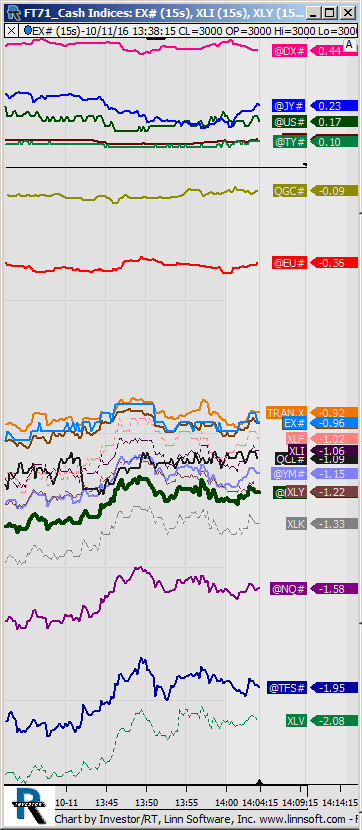
FT71 Cash Indices (EX#) futurestrader71 [totalcount]
7 years 7 months ago
This chart was uploaded by Investor/RT 12.6.3 showing symbol: EX#. |
View |
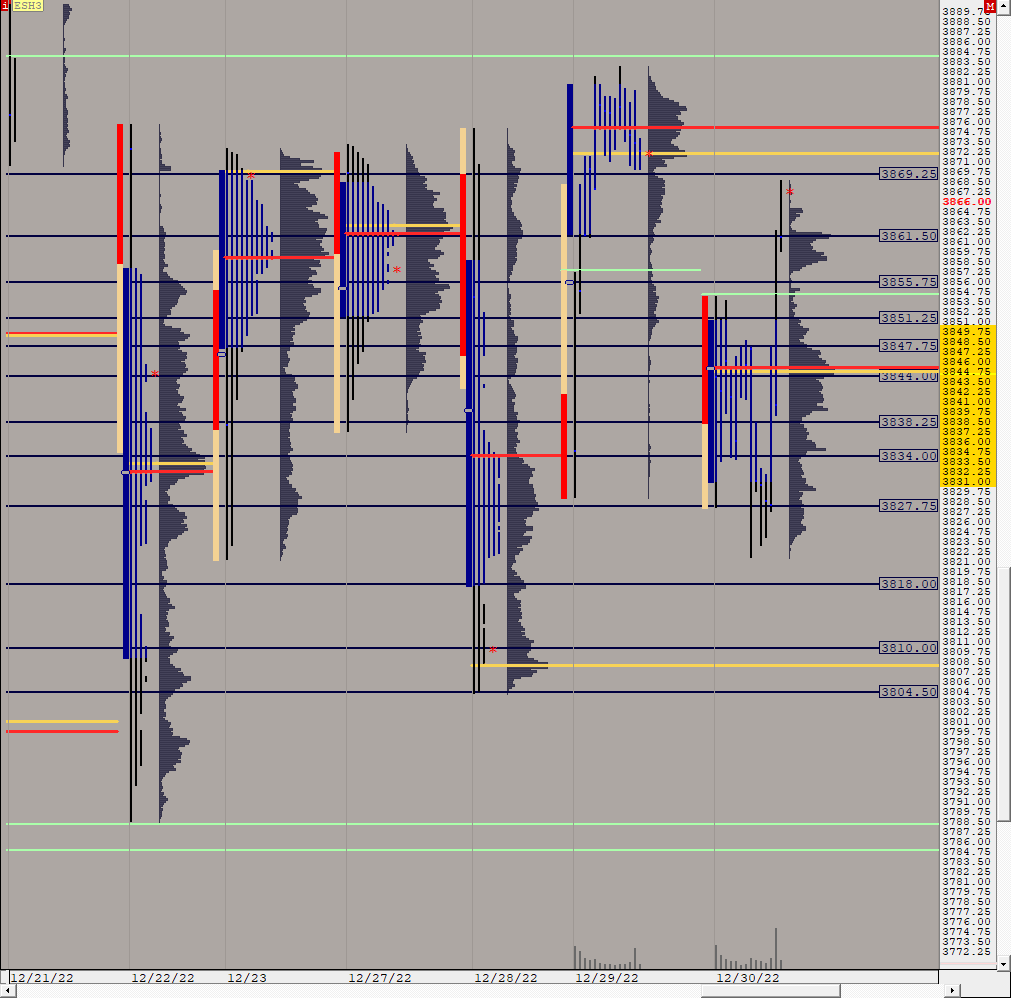 |
ESH3 new contract (ESH3) ES42 [totalcount]
1 year 4 months ago
This chart was uploaded by Investor/RT 15.1.12 showing symbol: ESH3. |
View |
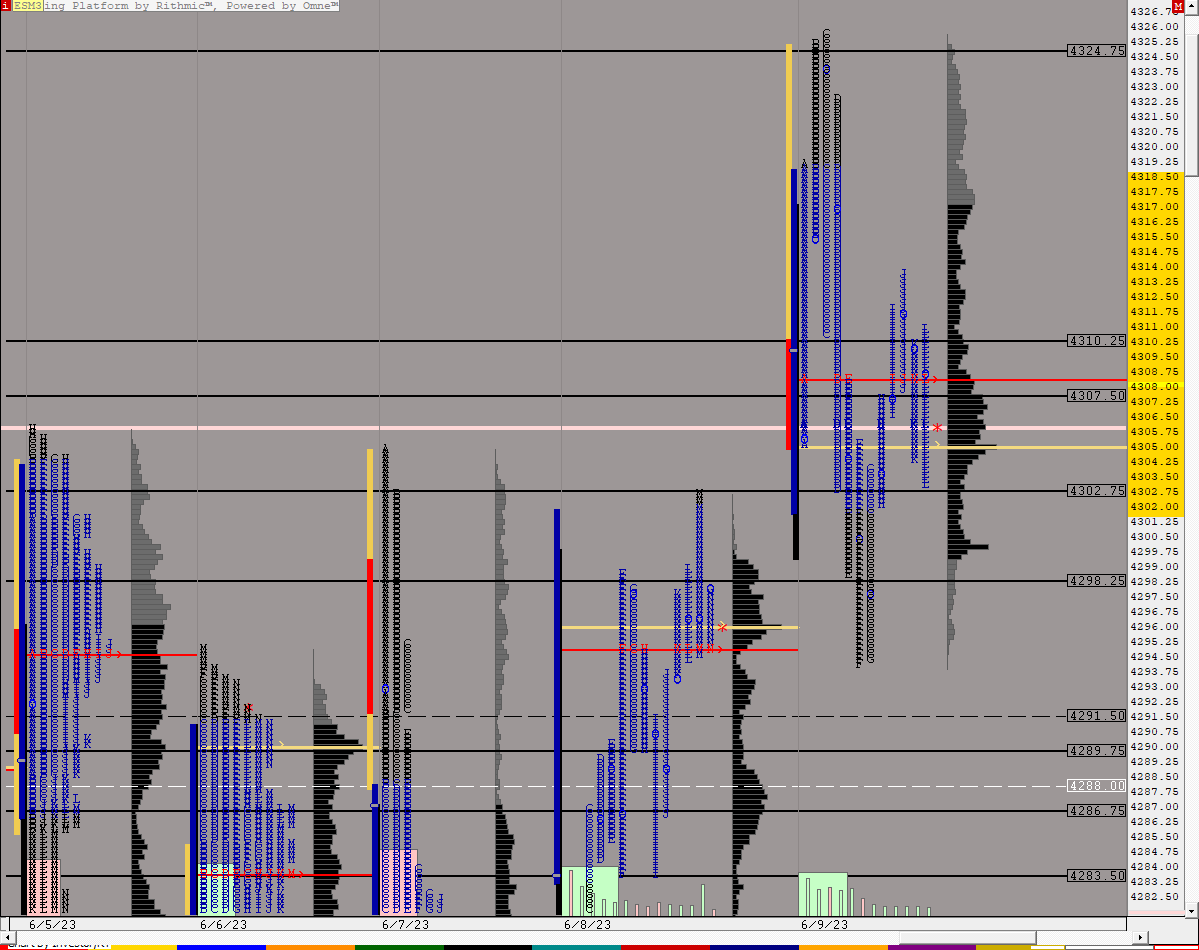 |
DAY ES (ESM3) ES42 [totalcount]
11 months 3 days ago
This chart was uploaded by Investor/RT 14.5.6 showing symbol: ESM3. |
View |
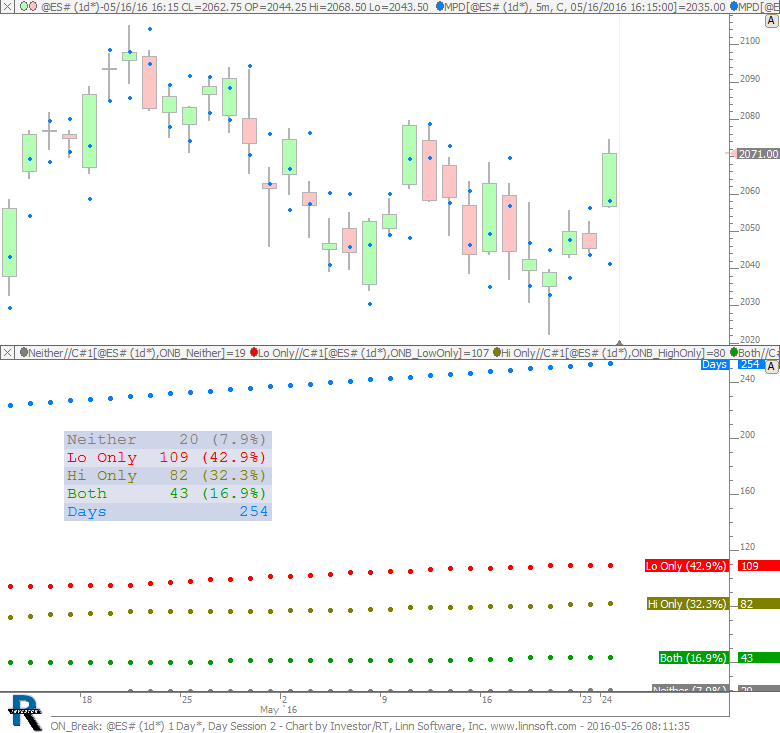 |
ON Break (@ES#) cpayne [totalcount]
7 years 11 months ago
Statistics on breaks of overnight high and low. This chart was uploaded by Investor/RT 12.5.9 showing symbol: @ES#. |
View |
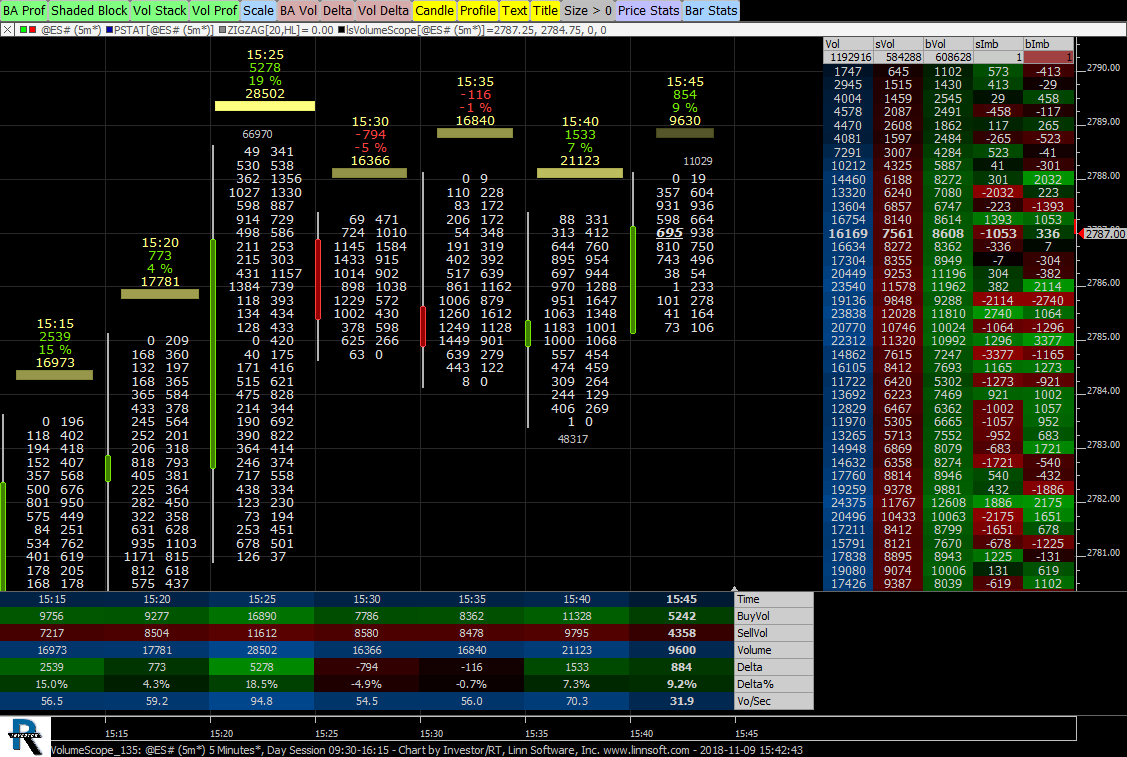 |
VolumeScope 135 (@ES#) cpayne [totalcount]
5 years 6 months ago
VolumeScope - Investor/RT 13.5 Webinar. This chart was uploaded by Investor/RT 13.5.9 showing symbol: @ES#. |
View |
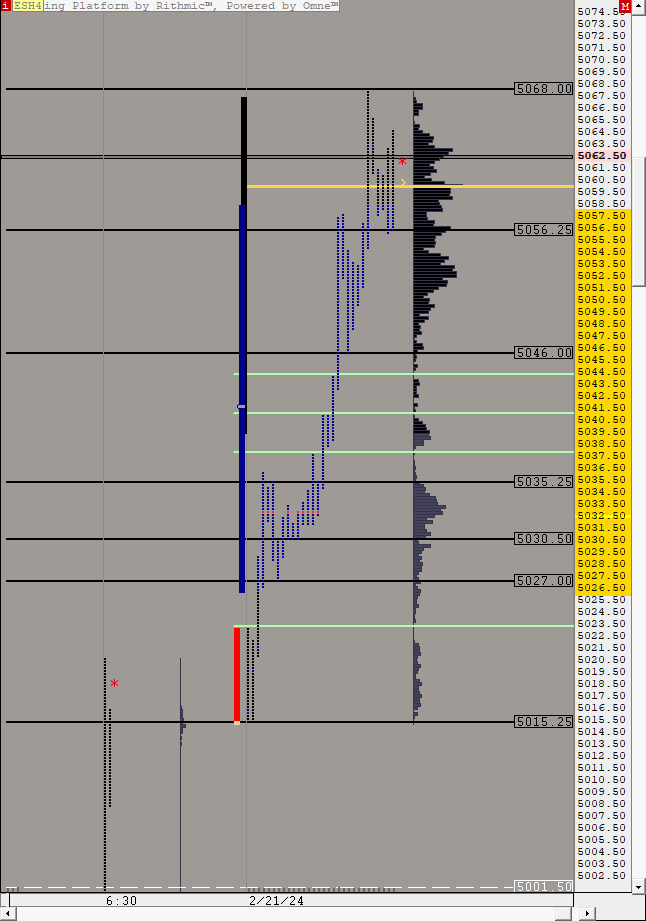 |
ES MARCH TPO (ESH4) ES42 [totalcount]
2 months 2 weeks ago
This chart was uploaded by Investor/RT 14.5.6 showing symbol: ESH4. |
View |
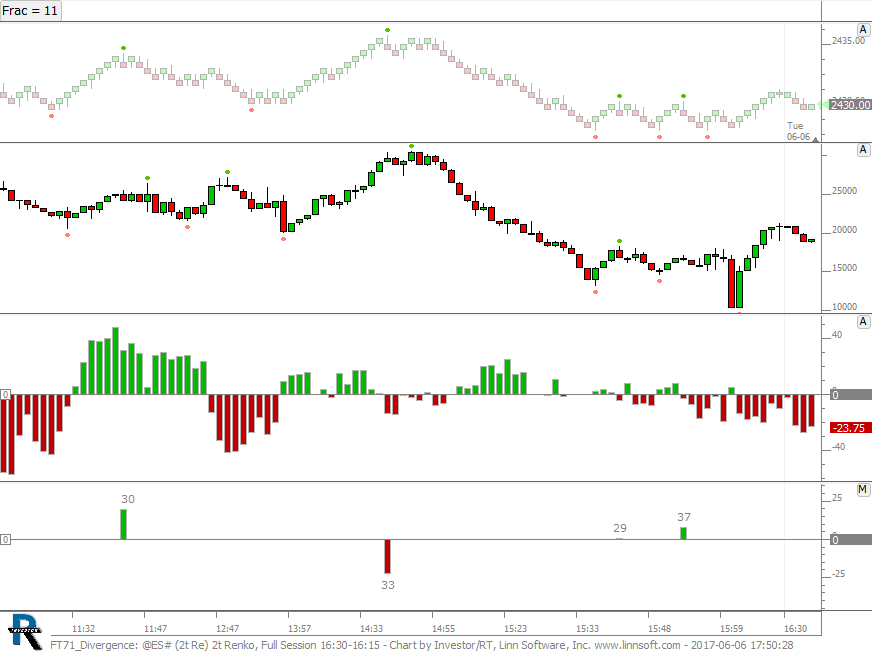 |
FT71 Divergence (@ES#) cpayne [totalcount]
6 years 11 months ago
Divergence chart used in FuturesTrader71 Webinar on June 6, 2017. This chart was uploaded by Investor/RT 12.7.5 showing symbol: @ES#. |
View |
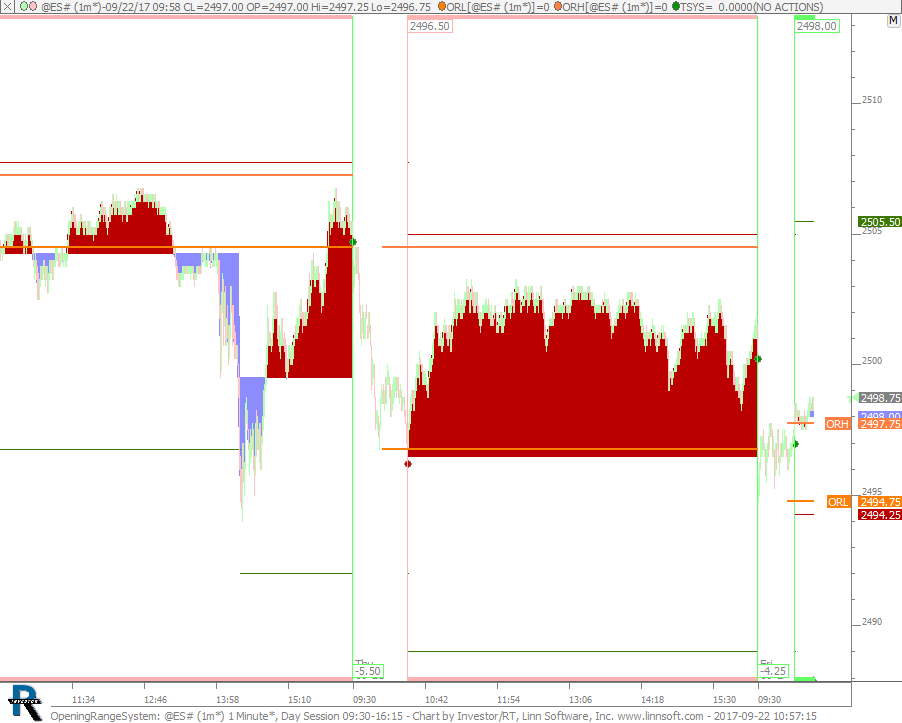 |
OpeningRangeSystem (@ES#) cpayne [totalcount]
6 years 7 months ago
Opening Range Trading System. This chart was uploaded by Investor/RT 13.1.1 showing symbol: @ES#. |
View |
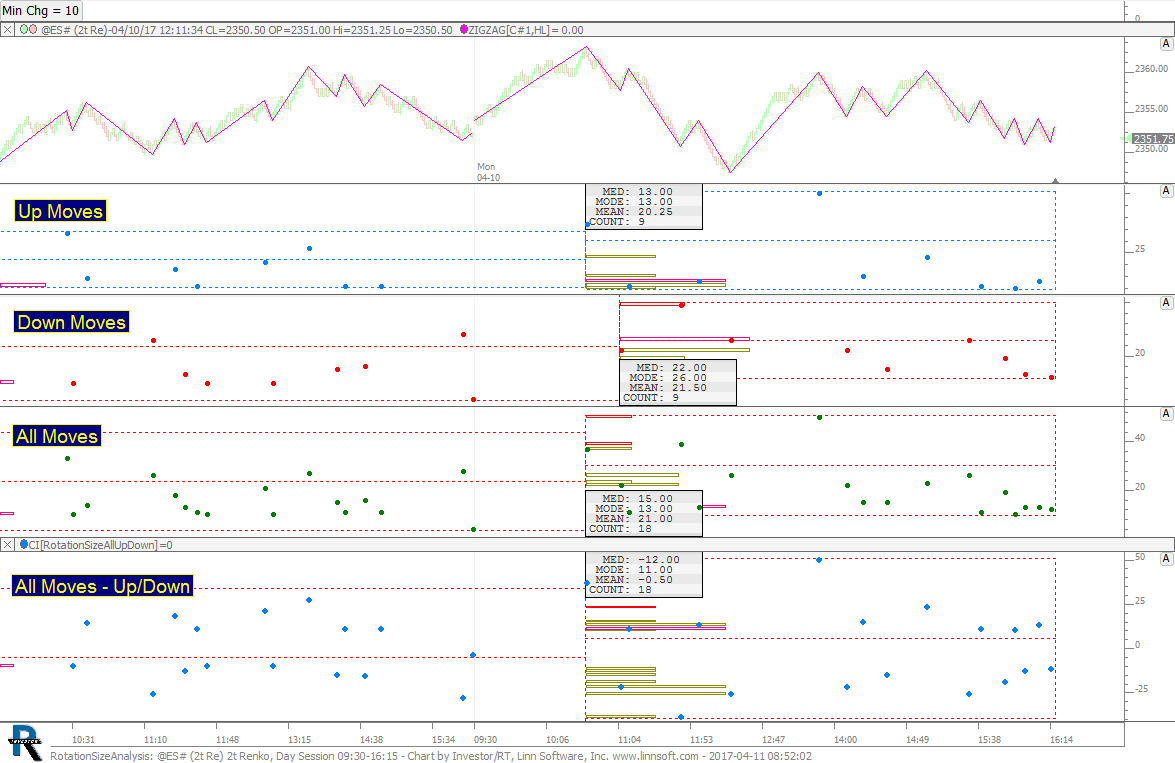 |
RotationSizeAnalysis (@ES#) cpayne [totalcount]
7 years 4 weeks ago
Rotation Size Analysis. This chart was uploaded by Investor/RT 12.5.5 showing symbol: @ES#. |
View |
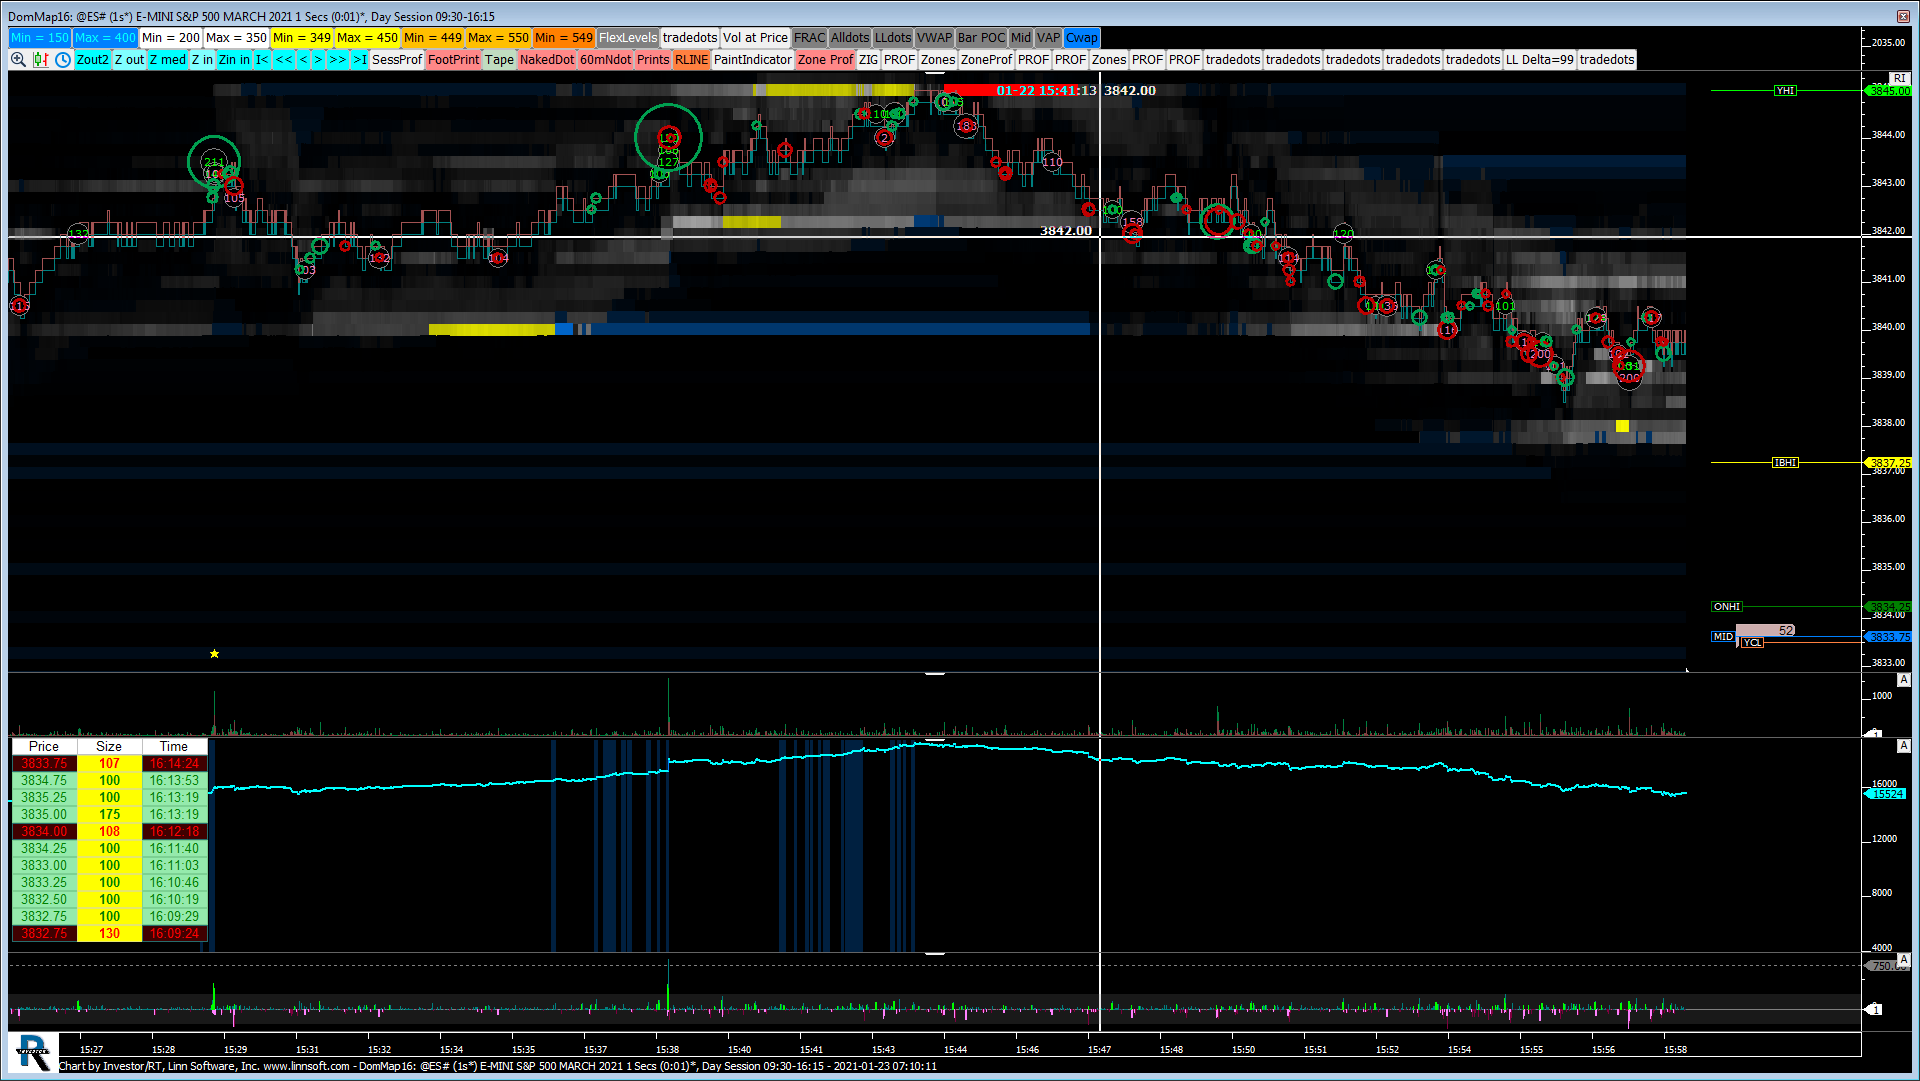 |
DomMap (@ES#) jayski51369 [totalcount]
3 years 3 months ago
This chart was uploaded by Investor/RT 13.2.3 showing symbol: @ES#. |
View |
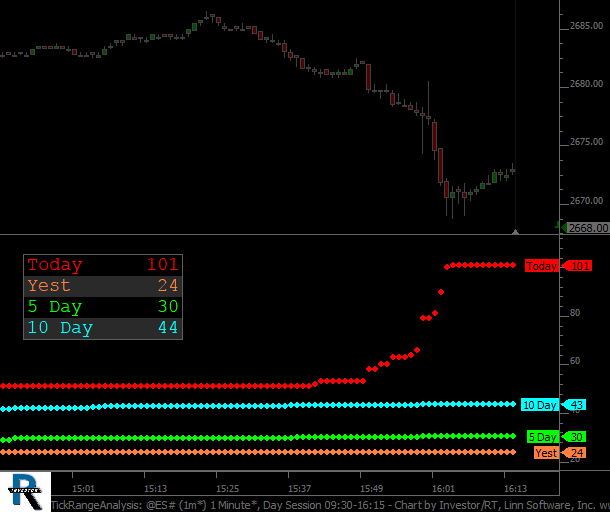 |
TickRangeAnalysis (@ES#) cpayne [totalcount]
6 years 4 months ago
Tick Range Analysis: Today vs Yesterday vs 5 Day Avg and 10 Day Avg (at time of day). This chart was uploaded by Investor/RT 13.1.4 showing symbol: @ES#. |
View |
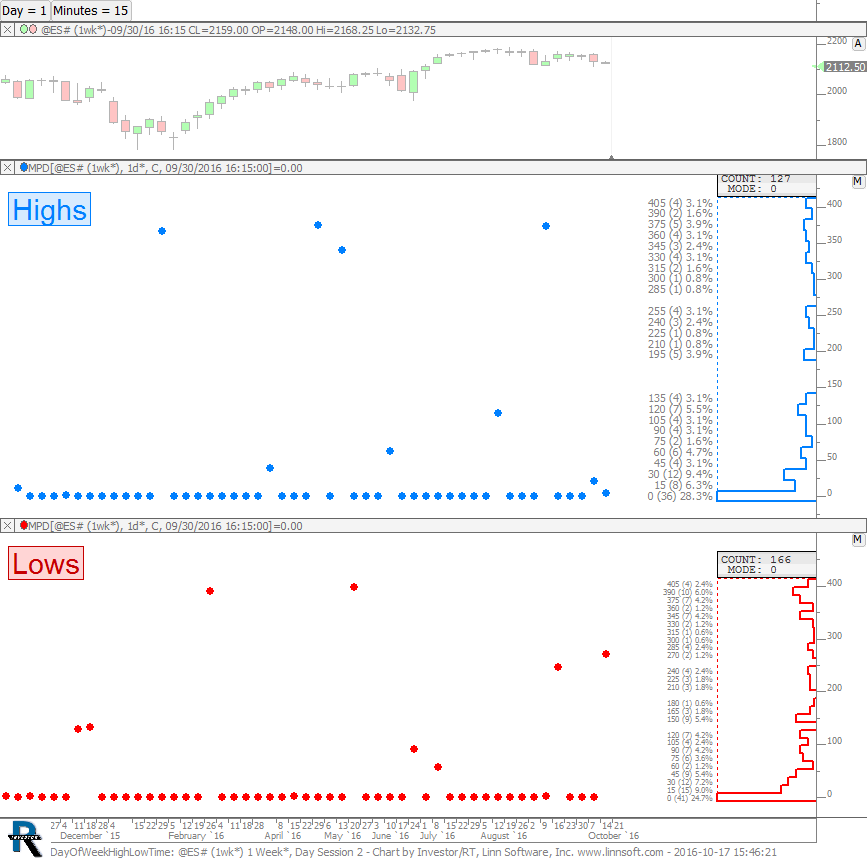 |
DayOfWeekHighLowTime (@ES#) cpayne [totalcount]
7 years 6 months ago
When High of Week was made on any particular day, what time of that day was high made?. This chart was uploaded by Investor/RT 12.6.6 showing symbol: @ES#. |
View |
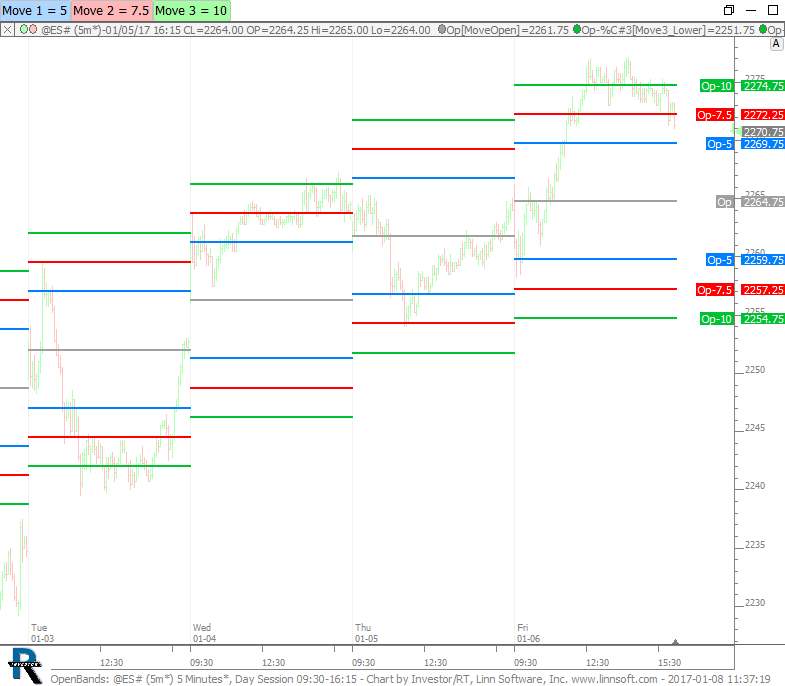 |
OpenBands (@ES#) cpayne [totalcount]
7 years 4 months ago
Measured bands from open. Control move magnitude with buttons. This chart was uploaded by Investor/RT 12.7.1 showing symbol: @ES#. |
View |
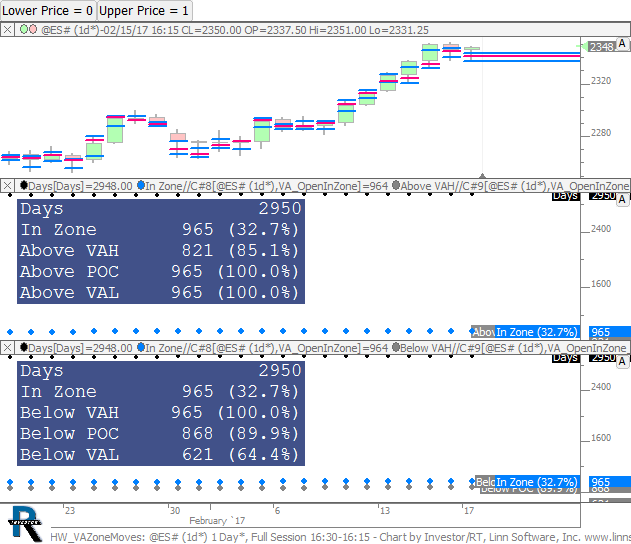 |
HW VAZoneMoves (@ES#) cpayne [totalcount]
7 years 2 months ago
Value Area Zone Move Analysis. This chart was uploaded by Investor/RT 12.7.1 showing symbol: @ES#. |
View |
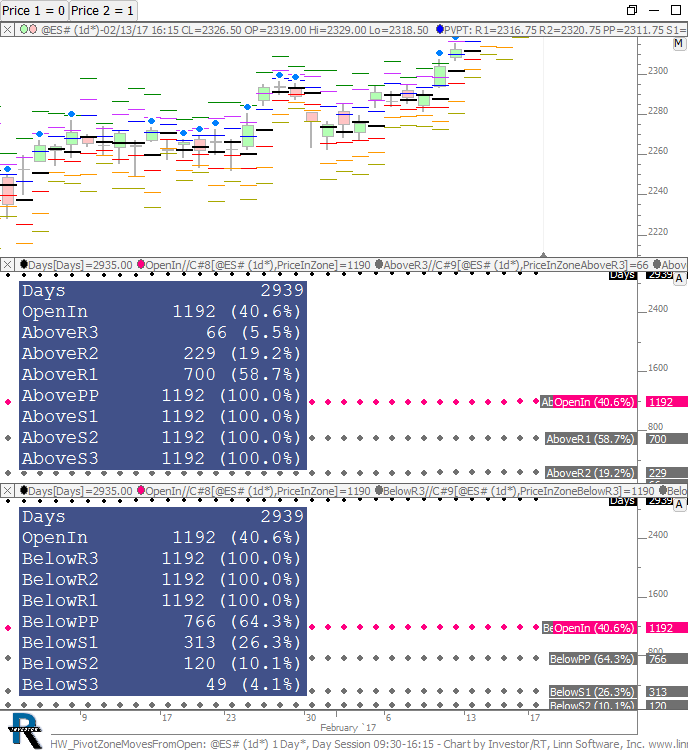 |
HW PivotZoneMovesFromOpen (@ES#) cpayne [totalcount]
7 years 2 months ago
Analyzes moves from opening pivot zone to each pivot level. This chart was uploaded by Investor/RT 12.7.1 showing symbol: @ES#. |
View |
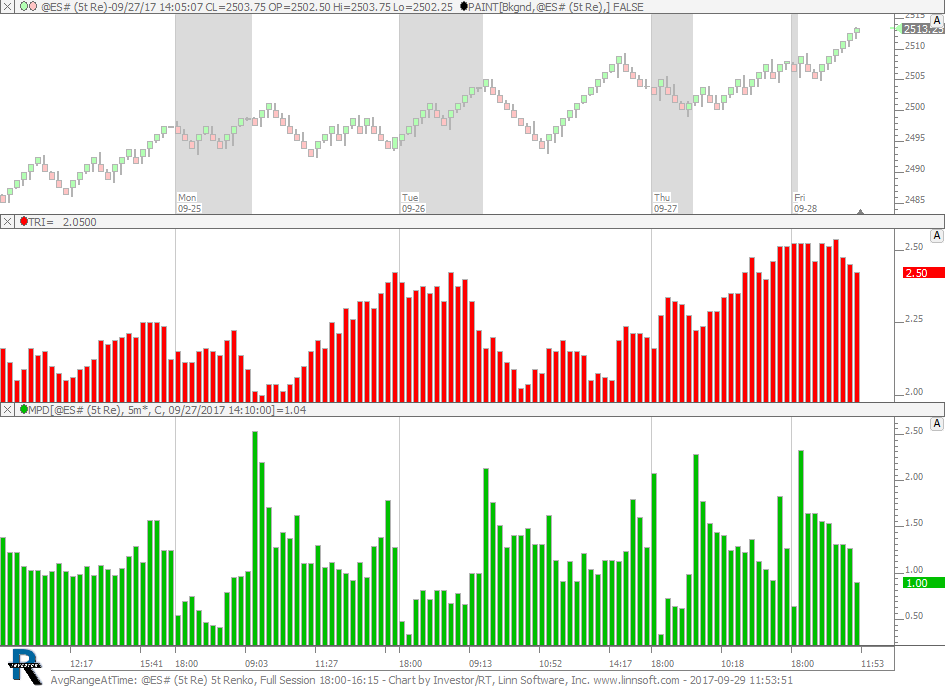 |
AvgRangeAtTime (@ES#) cpayne [totalcount]
6 years 7 months ago
Average Range at Time of Day. This chart is explained in the video Better Volatility. |
View |
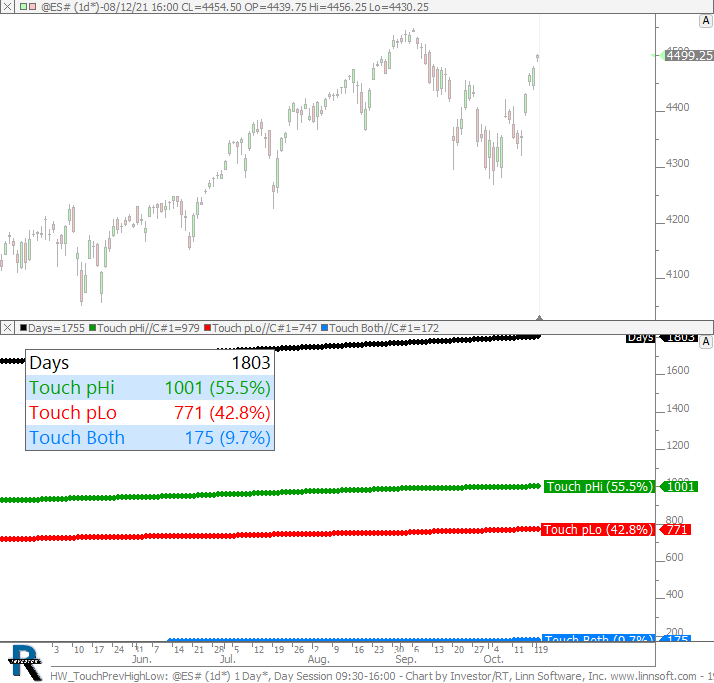 |
HW TouchPrevHighLow (@ES#) cpayne [totalcount]
2 years 6 months ago
How often did we touch previous days high, low, or both looking at the ES Day Session only. This chart was uploaded by Investor/RT 15.1.1 showing symbol: @ES#. |
View |
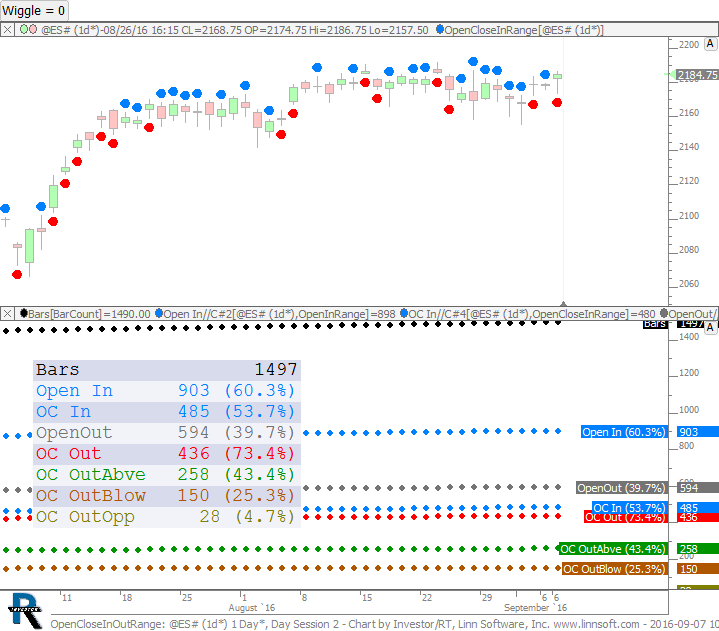 |
OpenCloseInOutRange (@ES#) cpayne [totalcount]
7 years 8 months ago
Counts Days Open and Close were both inside range. (or both outside range) with an optional wiggle (in ticks) controlled by button. |
View |
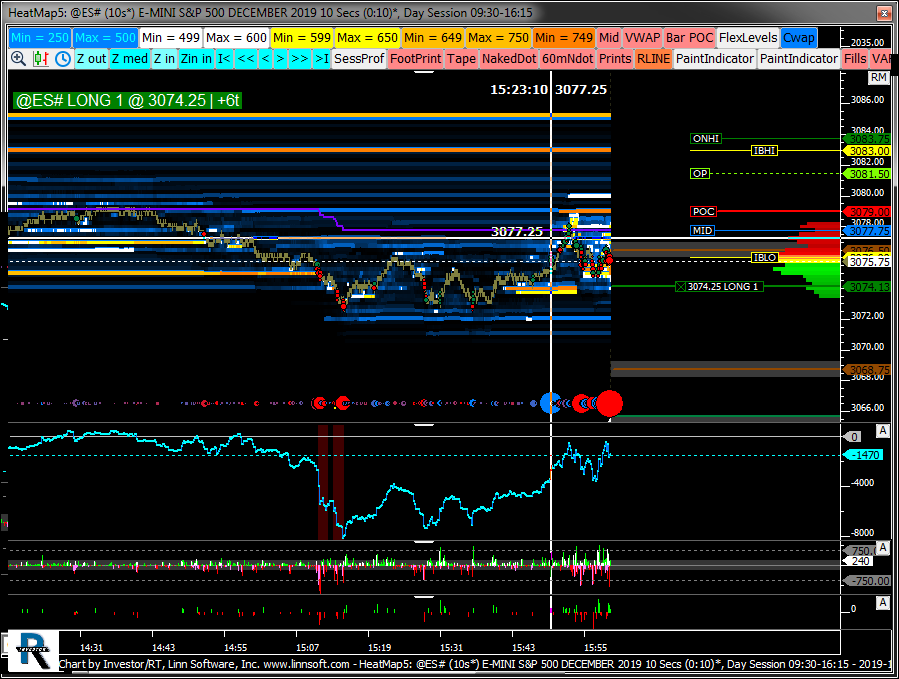 |
HeatMap (@ES#) jayski51369 [totalcount]
4 years 6 months ago
This chart was uploaded by Investor/RT 13.6.4 showing symbol: @ES#. |
View |
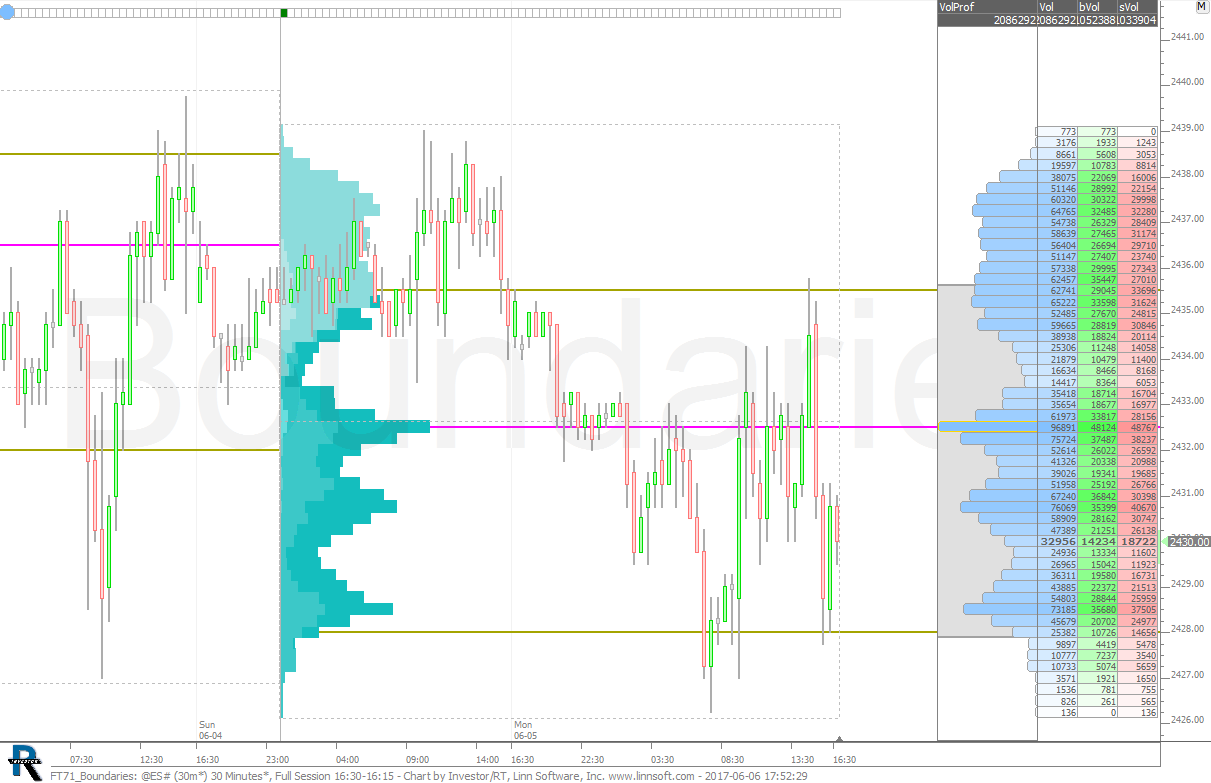 |
FT71 Boundaries (@ES#) cpayne [totalcount]
6 years 11 months ago
Boundaries chart used in FuturesTrader71 Webinar on June 6, 2017. This chart was uploaded by Investor/RT 12.7.5 showing symbol: @ES#. |
View |
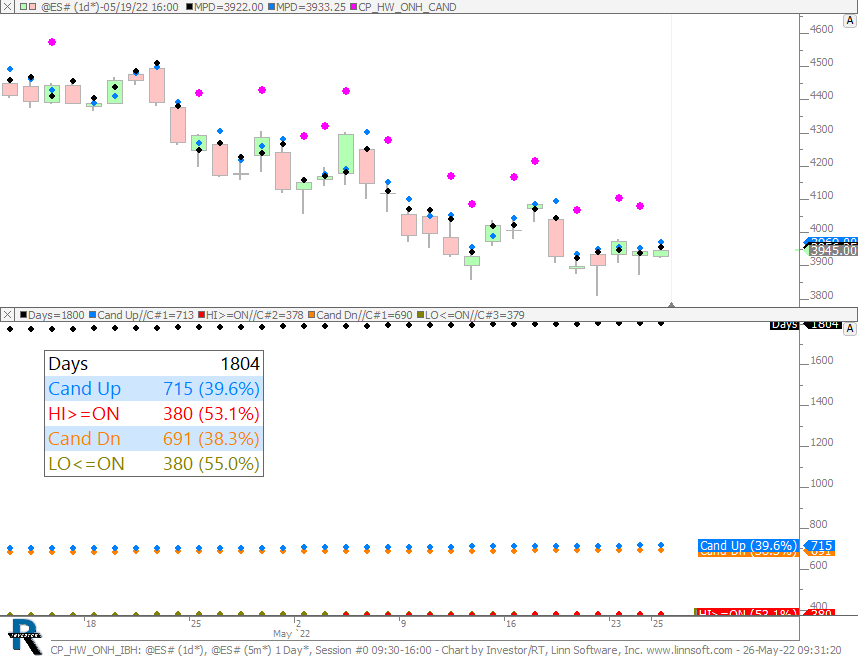 |
CP HW ONH IBH (@ES#) cpayne [totalcount]
1 year 11 months ago
This chart was uploaded by Investor/RT 15.1.4 showing symbol: @ES#. |
View |
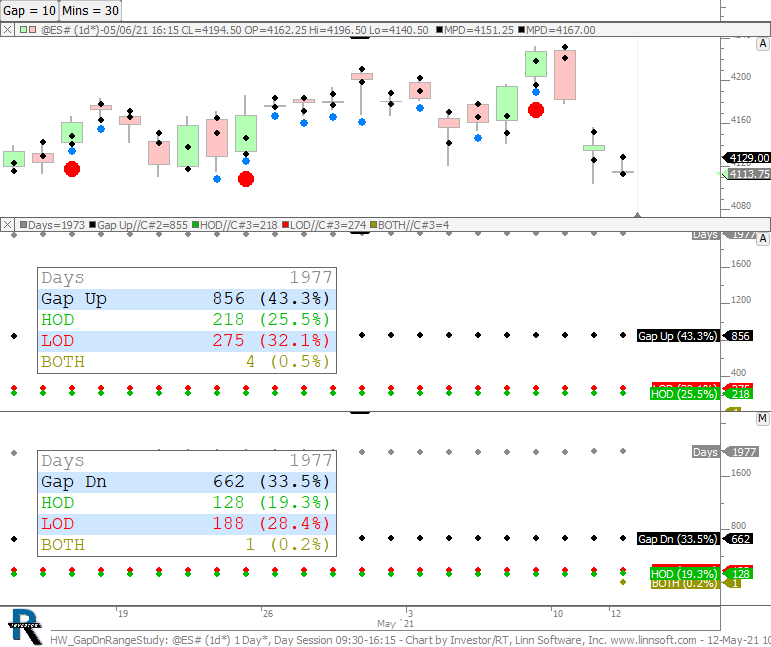 |
HW GapDnRangeStudy (@ES#) cpayne [totalcount]
2 years 12 months ago
Gap Up and Gap Down Days. How often is the HOD and LOD created in first X minutes on days that gap up or down. Gap (in ticks) and X Minutes both controlled by buttons at top. |
View |
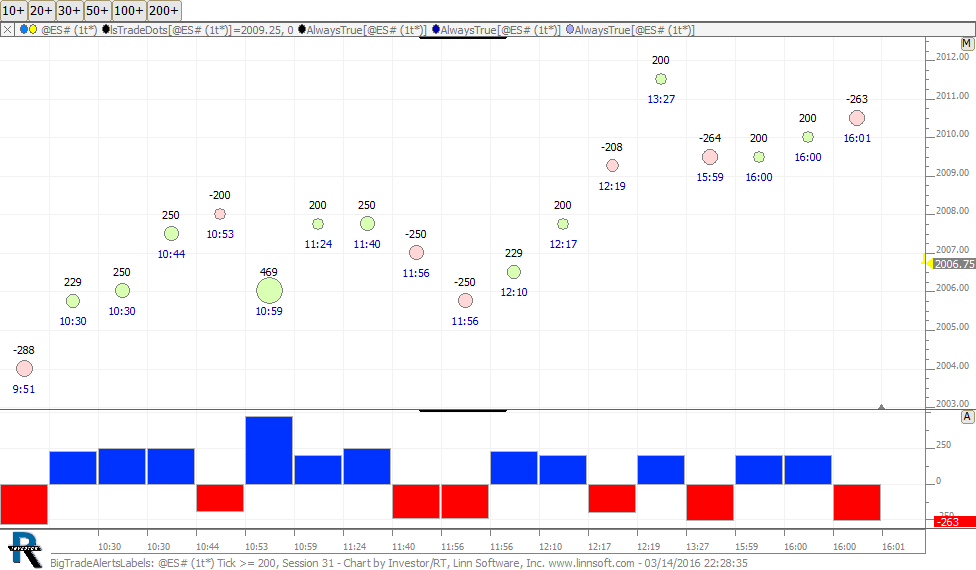 |
BigTradeAlertsLabels (@ES#) 2 cpayne [totalcount]
8 years 1 month ago
This chart was uploaded by Investor/RT on Mon, 03/14/2016 - 22:28 showing symbol: @ES#. Created by Chad Payne. |
View |
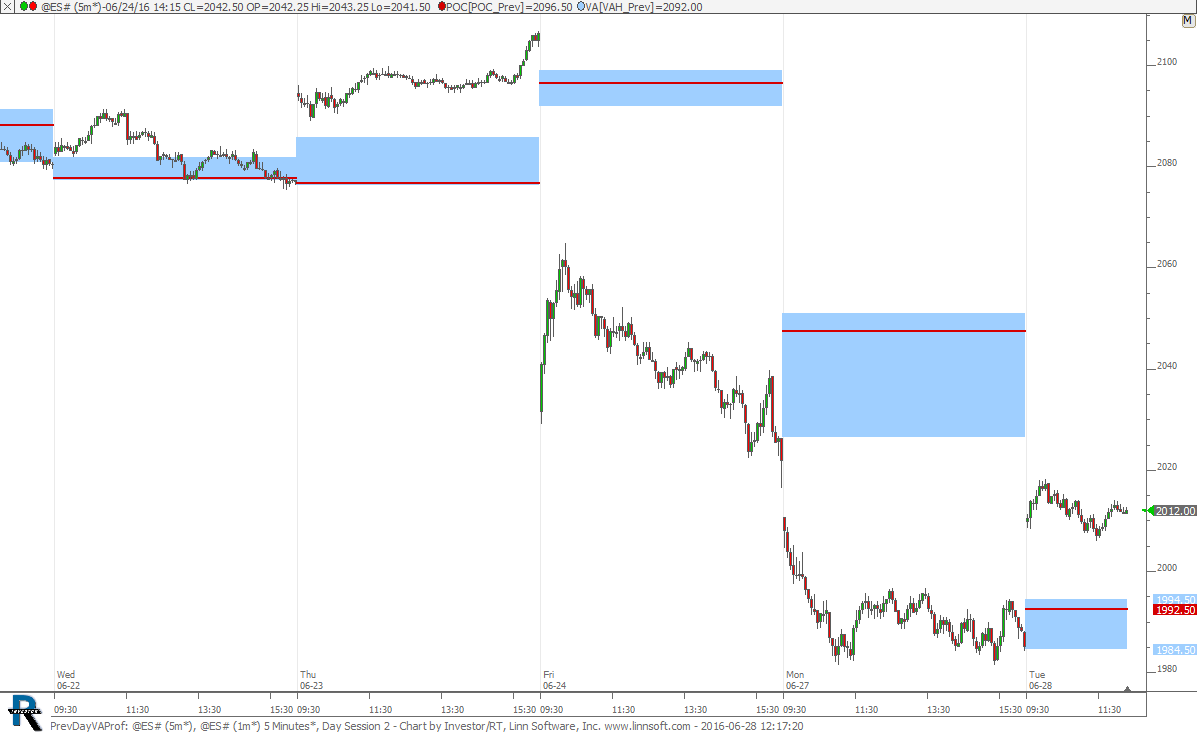 |
PrevDayVAProf (@ES#) cpayne [totalcount]
7 years 10 months ago
Previous Day VA & POC - Bands Indicator. This chart was uploaded by Investor/RT 12.6.1 showing symbol: @ES#. |
View |
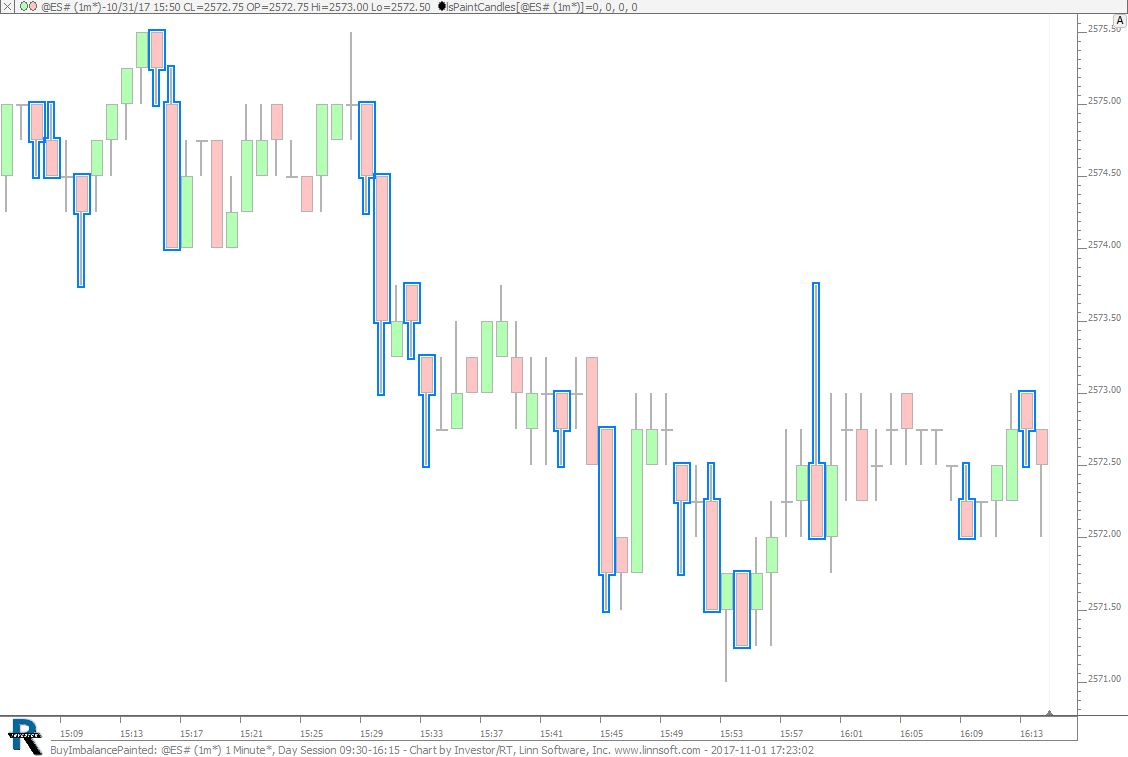 |
BuyImbalancePainted (@ES#) cpayne [totalcount]
6 years 6 months ago
Buy Imbalance Painted. This chart was uploaded by Investor/RT 13.1.1 showing symbol: @ES#. |
View |