 |
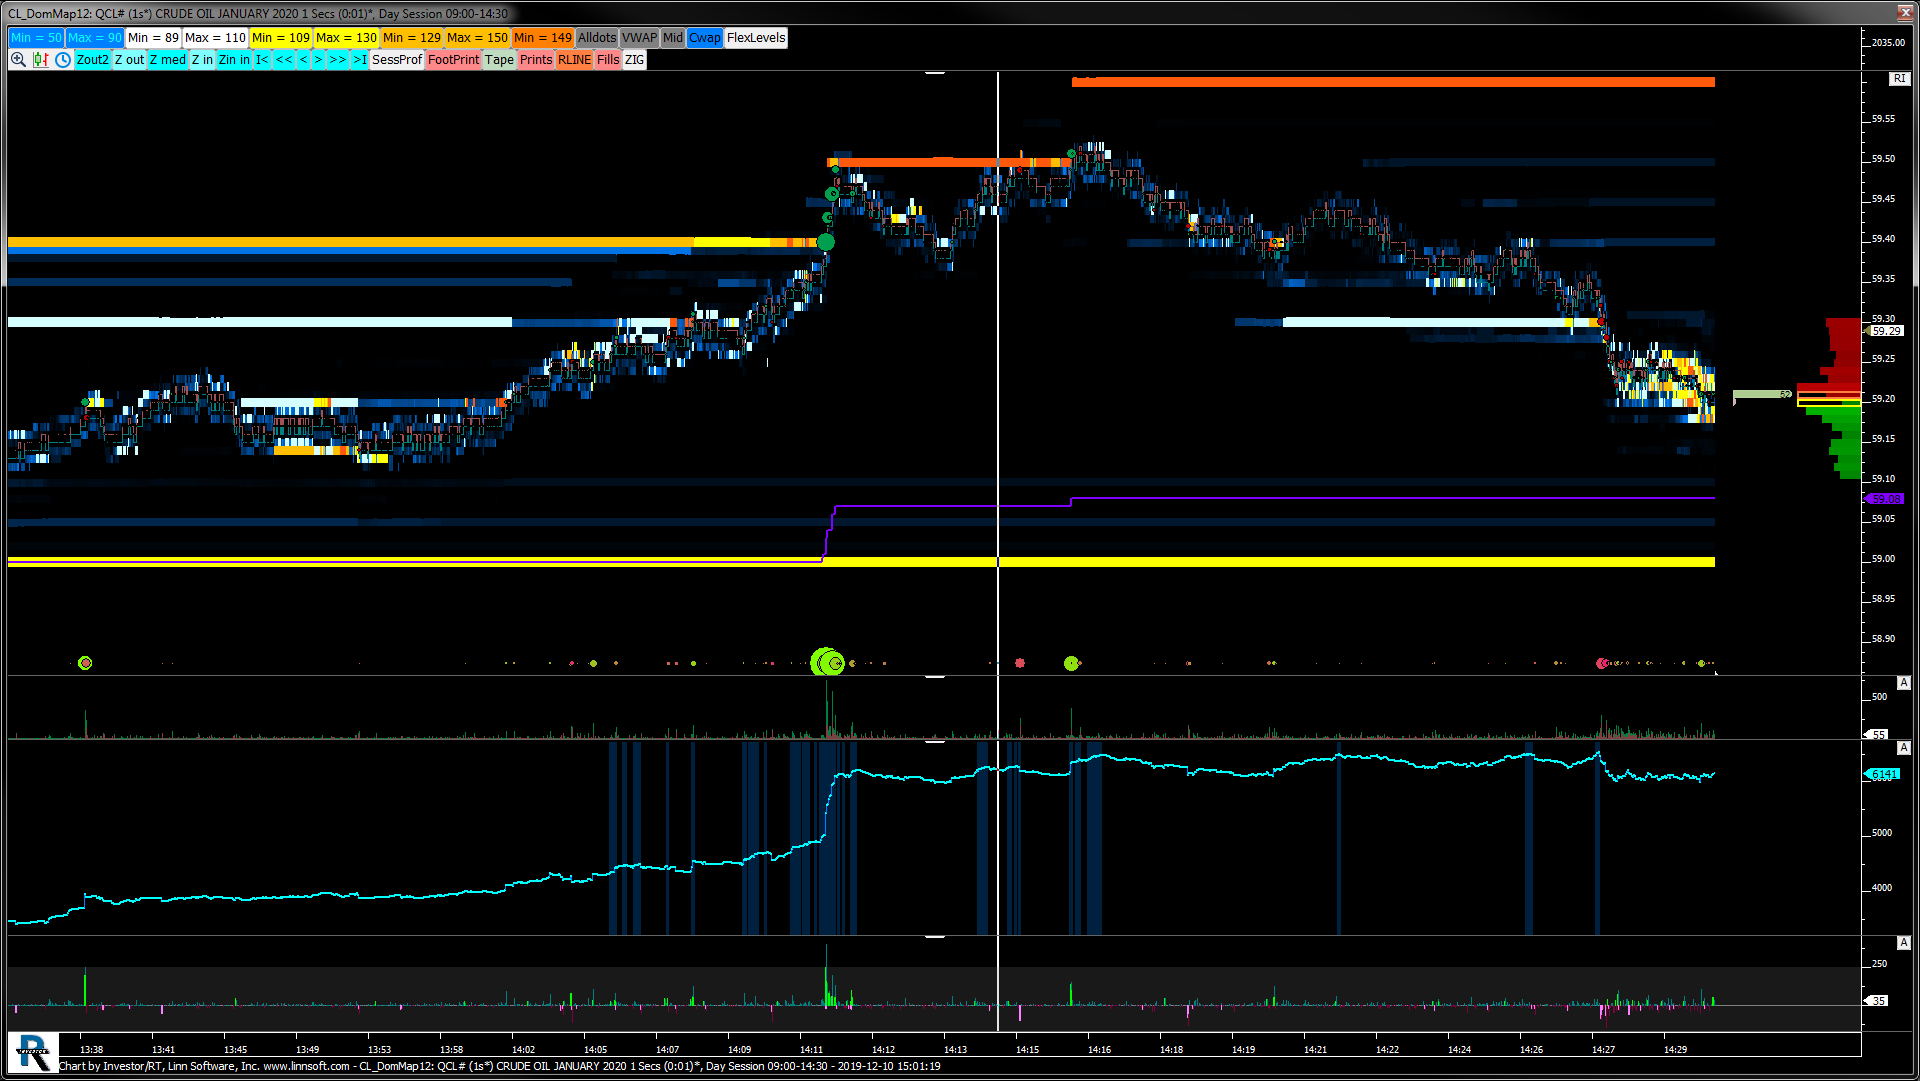
CL DomMap (QCL#) jayski51369 [totalcount]
4 years 5 months ago
This chart was uploaded by Investor/RT 13.1.2 showing symbol: QCL#. |
View |
 |
SPX CASH (SPX.XO) ES42 [totalcount]
6 months 1 week ago
This chart was uploaded by Investor/RT 14.5.4 showing symbol: SPX.XO. |
View |
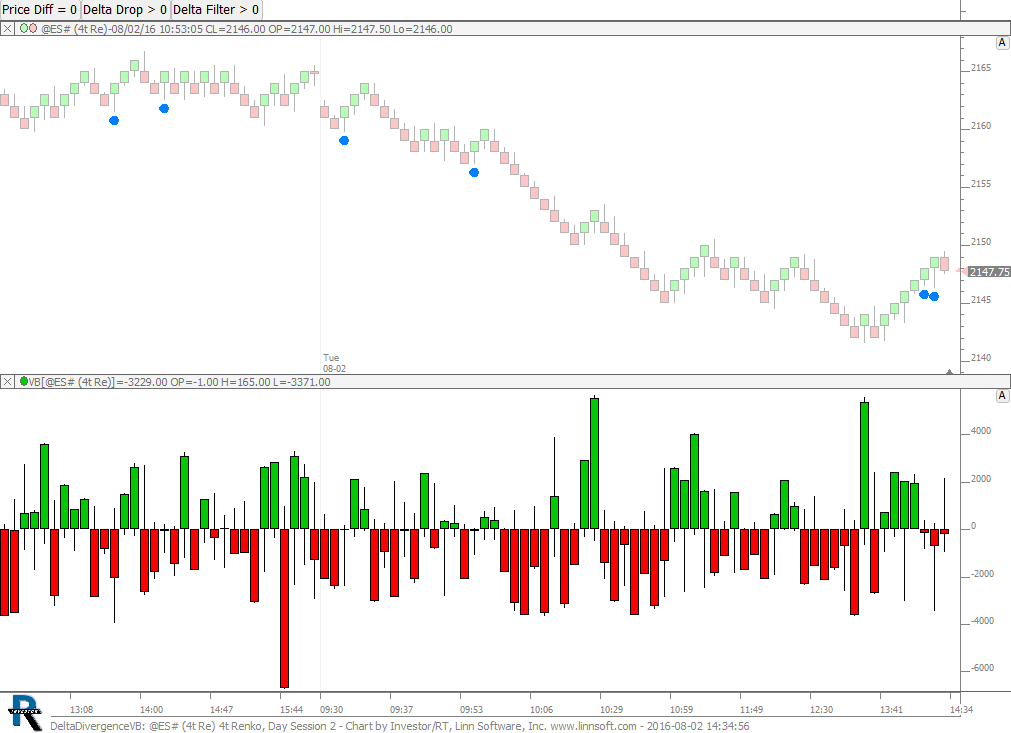 |
DeltaDivergenceVB (@ES#) cpayne [totalcount]
7 years 9 months ago
Delta Divergence - Price vs Delta Bars. This chart was uploaded by Investor/RT 12.6.1 showing symbol: @ES#. |
View |
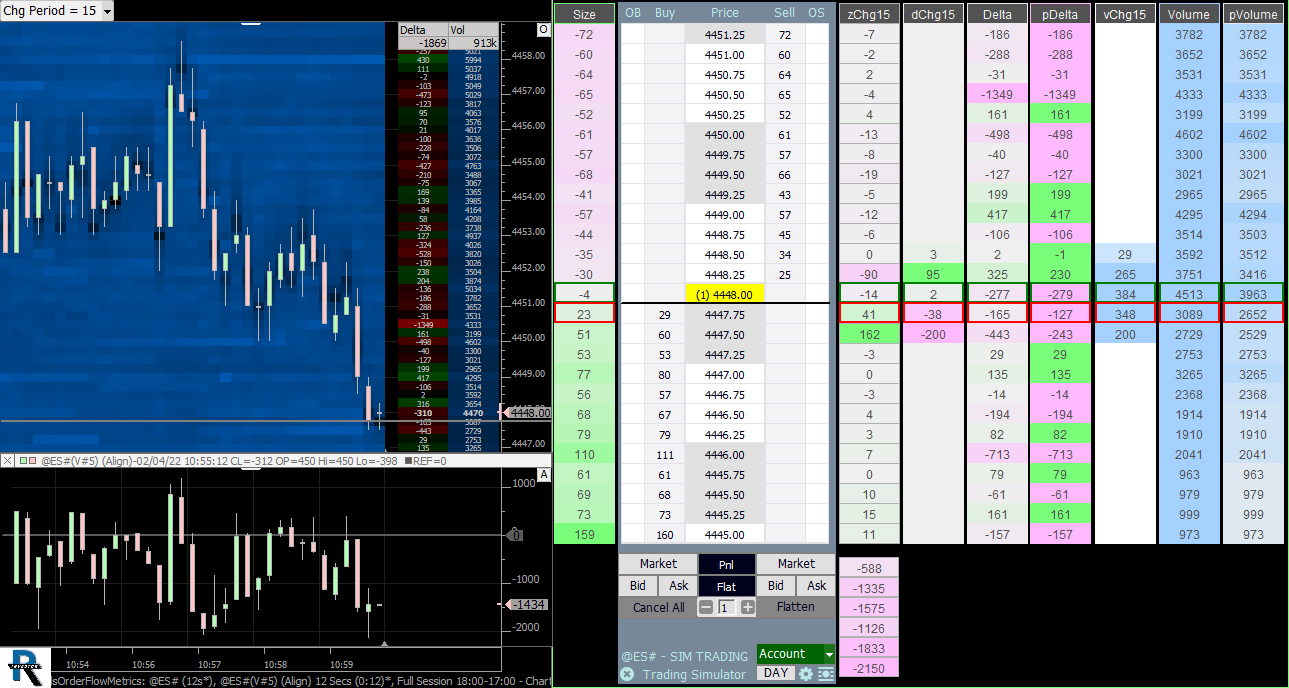 |
lsOrderFlowMetrics (@ES#) cpayne [totalcount]
2 years 3 months ago
OrderFlowMetrics. This chart was uploaded by Investor/RT 15.1.1 showing symbol: @ES#. |
View |
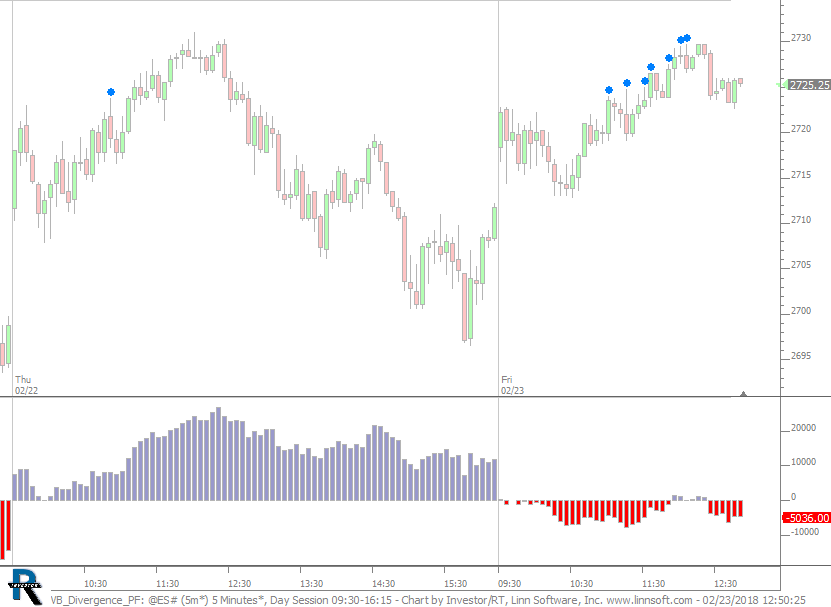 |
VB Divergence PF (@ES#) cpayne [totalcount]
6 years 2 months ago
Price making new high of day while cumulative delta (up/down tick) is not. This chart was uploaded by Investor/RT 13.2.4 showing symbol: @ES#. |
View |
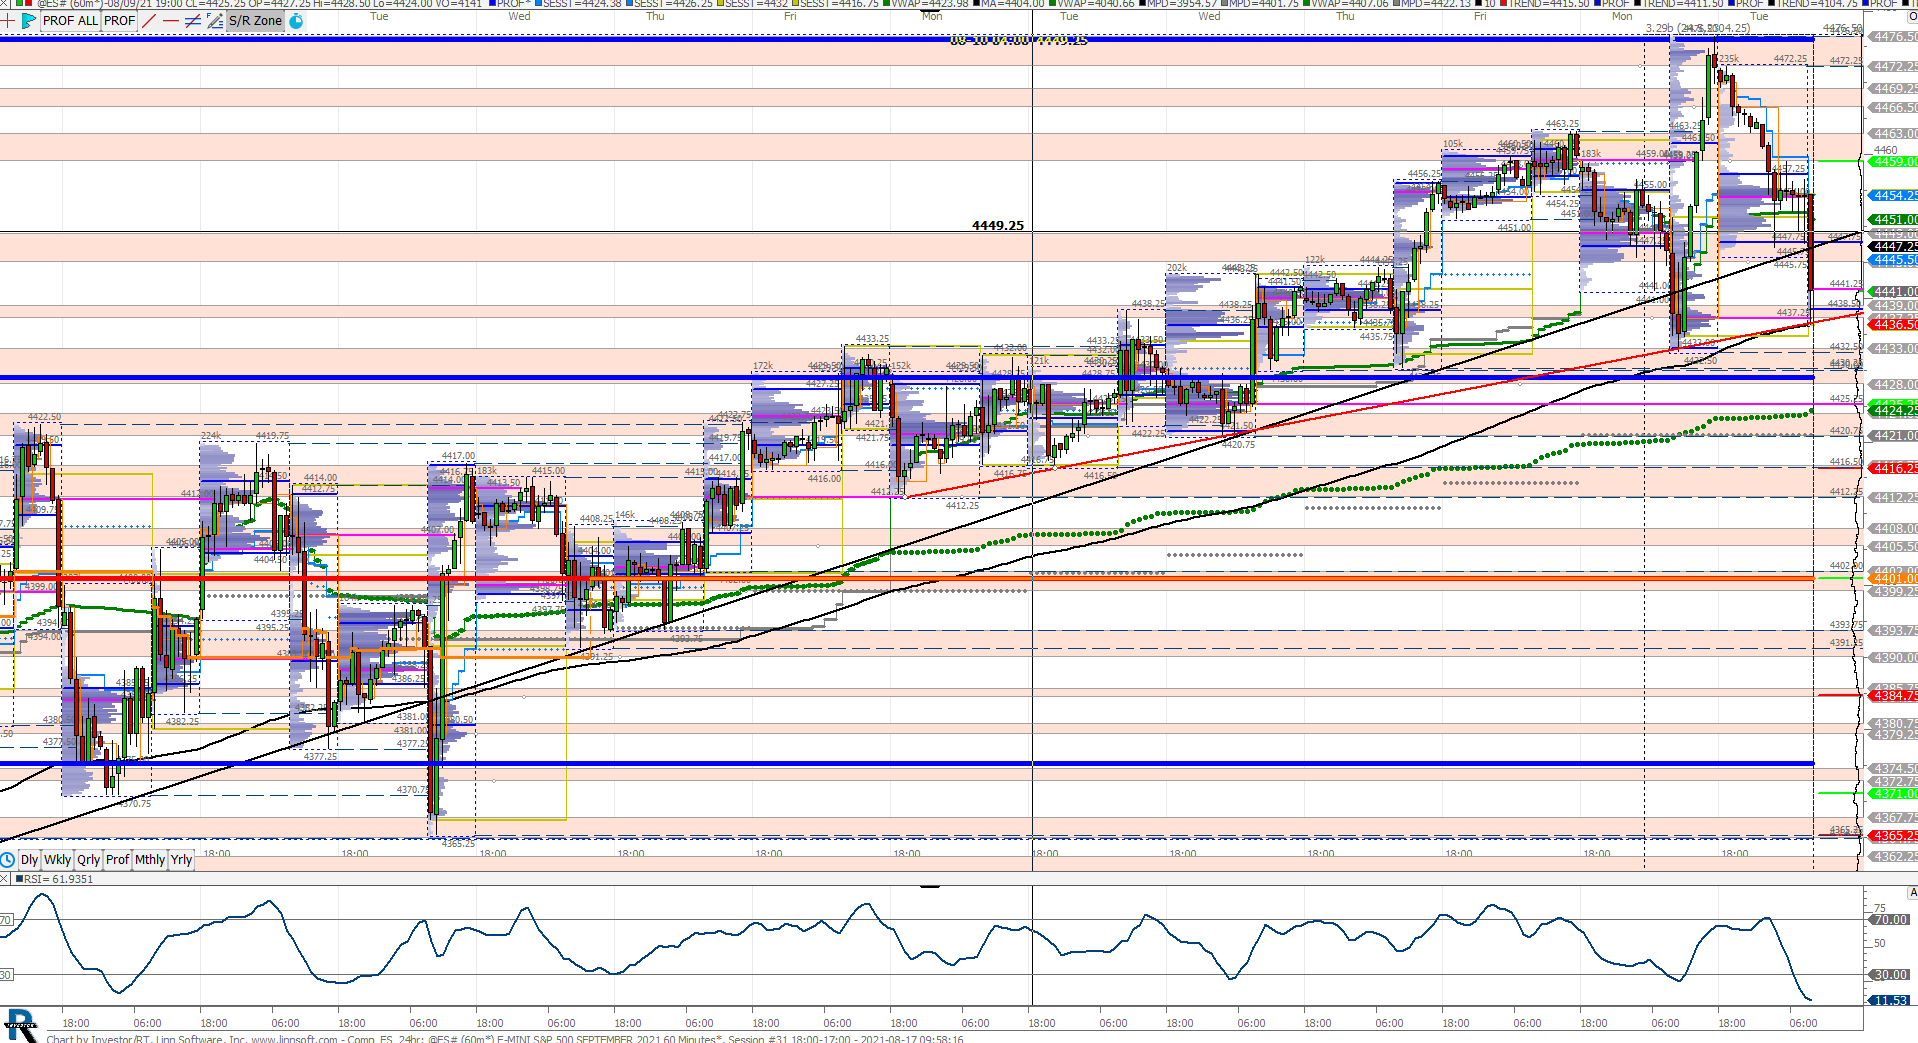 |
Comp ES 24hr (@ES#) npettinato [totalcount]
2 years 9 months ago
This chart was uploaded by Investor/RT 13.5.19 showing symbol: @ES#. |
View |
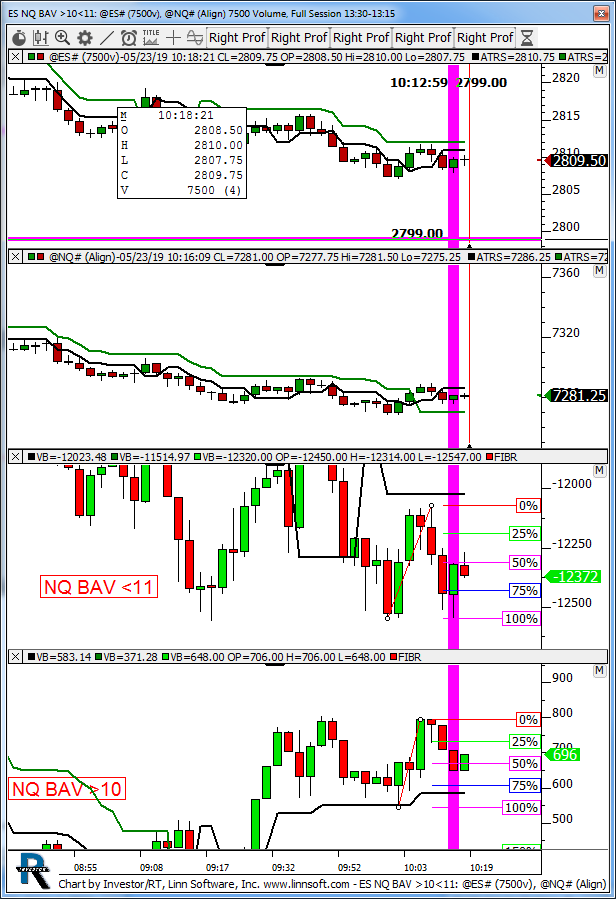 |
ES NQ BAV 1011 (@ES#) kencassorla [totalcount]
4 years 12 months ago
nq bav. This chart was uploaded by Investor/RT 13.5.24 showing symbol: @ES#. |
View |
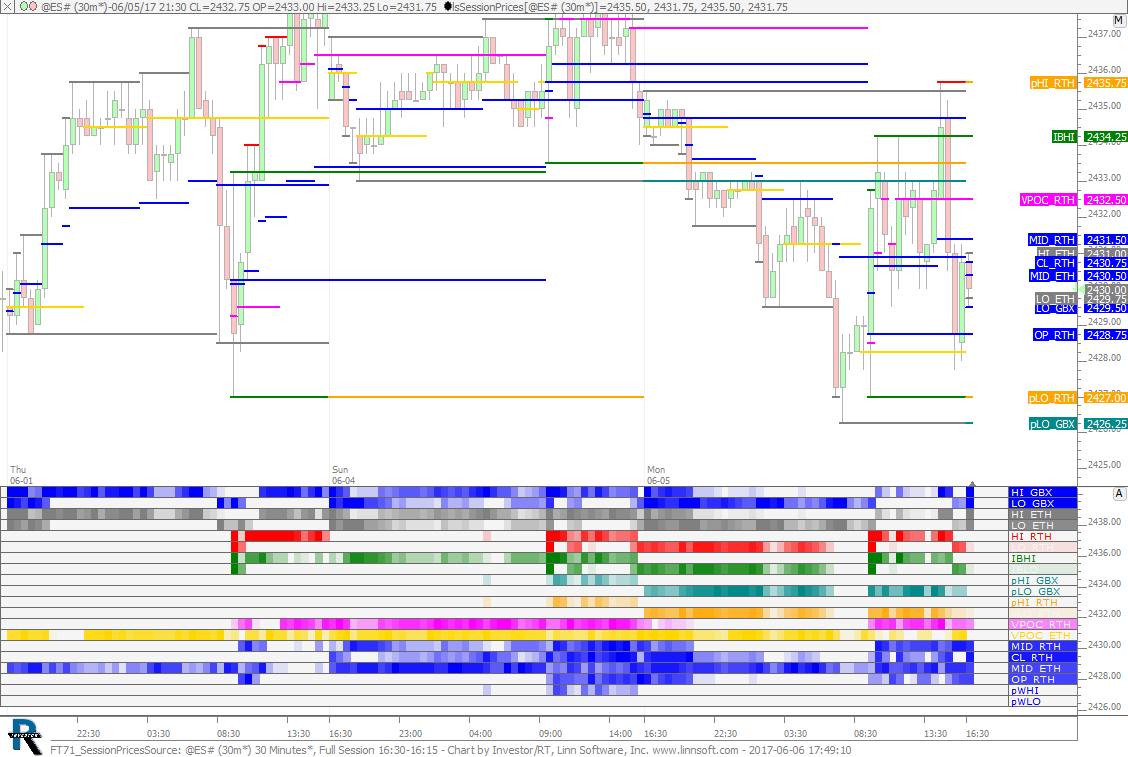 |
FT71 SessionPricesSource (@ES#) cpayne [totalcount]
6 years 11 months ago
SessionPrices chart used in FuturesTrader71 Webinar on June 6, 2017. This chart was uploaded by Investor/RT 12.7.5 showing symbol: @ES#. |
View |
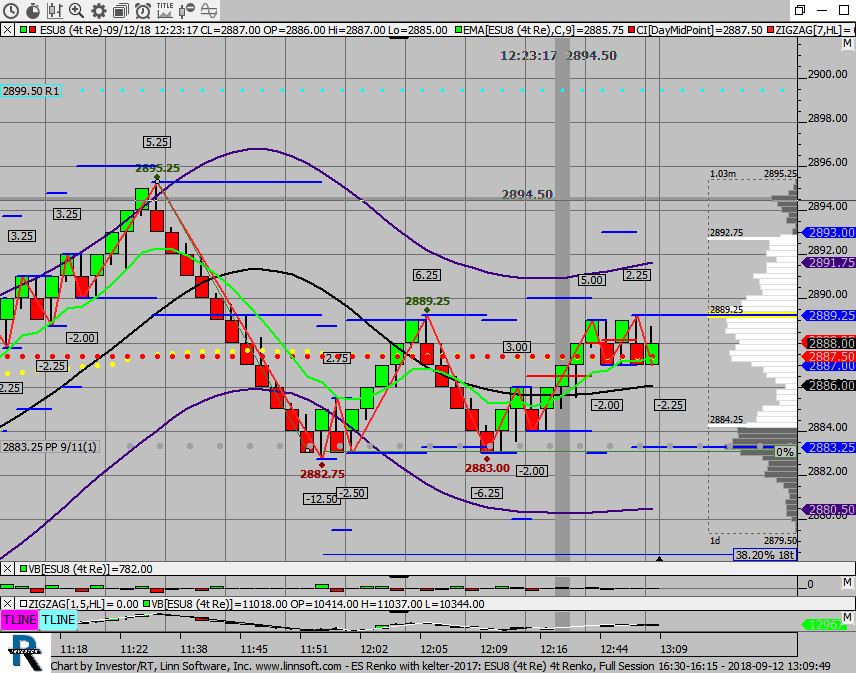 |
ES Renko with kelter (ESU8) Quantum Leap [totalcount]
5 years 8 months ago
This chart was uploaded by Investor/RT 13.3.5 showing symbol: ESU8. |
View |
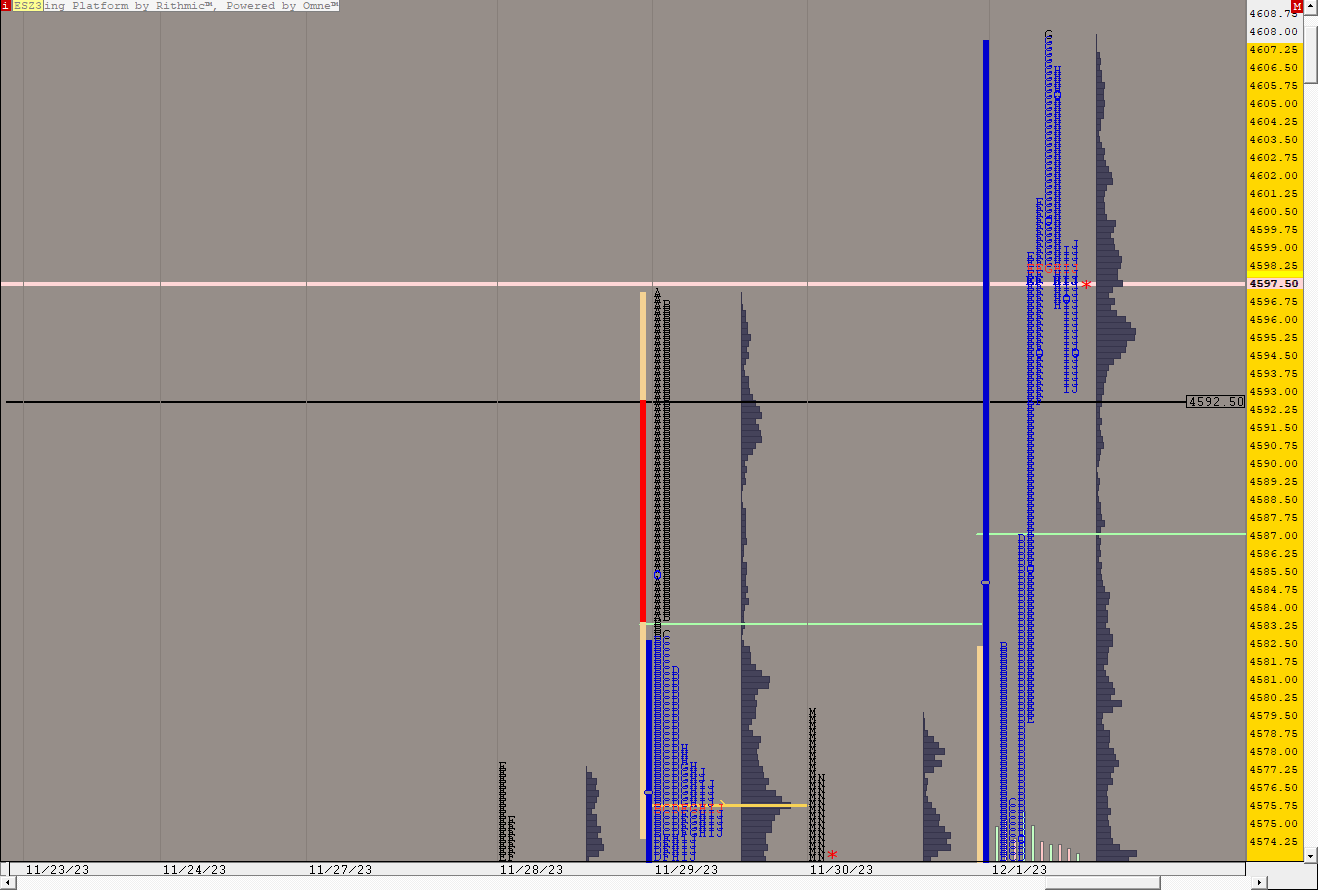 |
ESDAYTPO (ESZ3) ES42 [totalcount]
5 months 2 weeks ago
This chart was uploaded by Investor/RT 15.1.16 showing symbol: ESZ3. |
View |
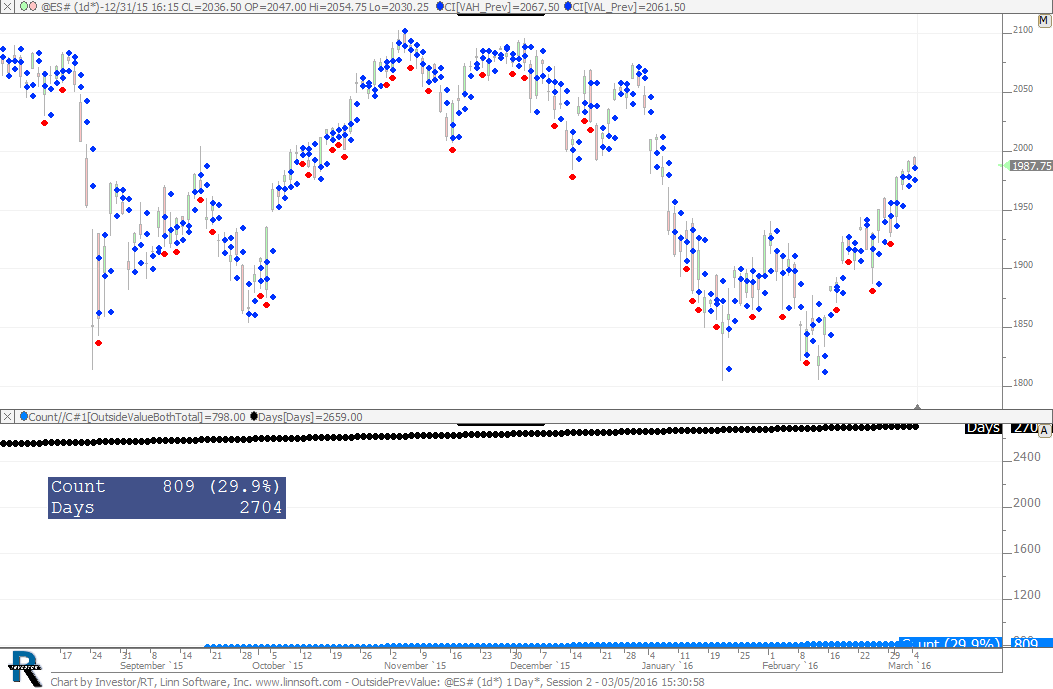 |
OutsidePrevValue How Often Does Price Breach Both Sides of Previous Value Area (@ES#) 2 cpayne [totalcount]
8 years 2 months ago
This chart was uploaded by Investor/RT on Sat, 03/05/2016 - 15:30 showing symbol: @ES#. Created by Chad Payne. |
View |
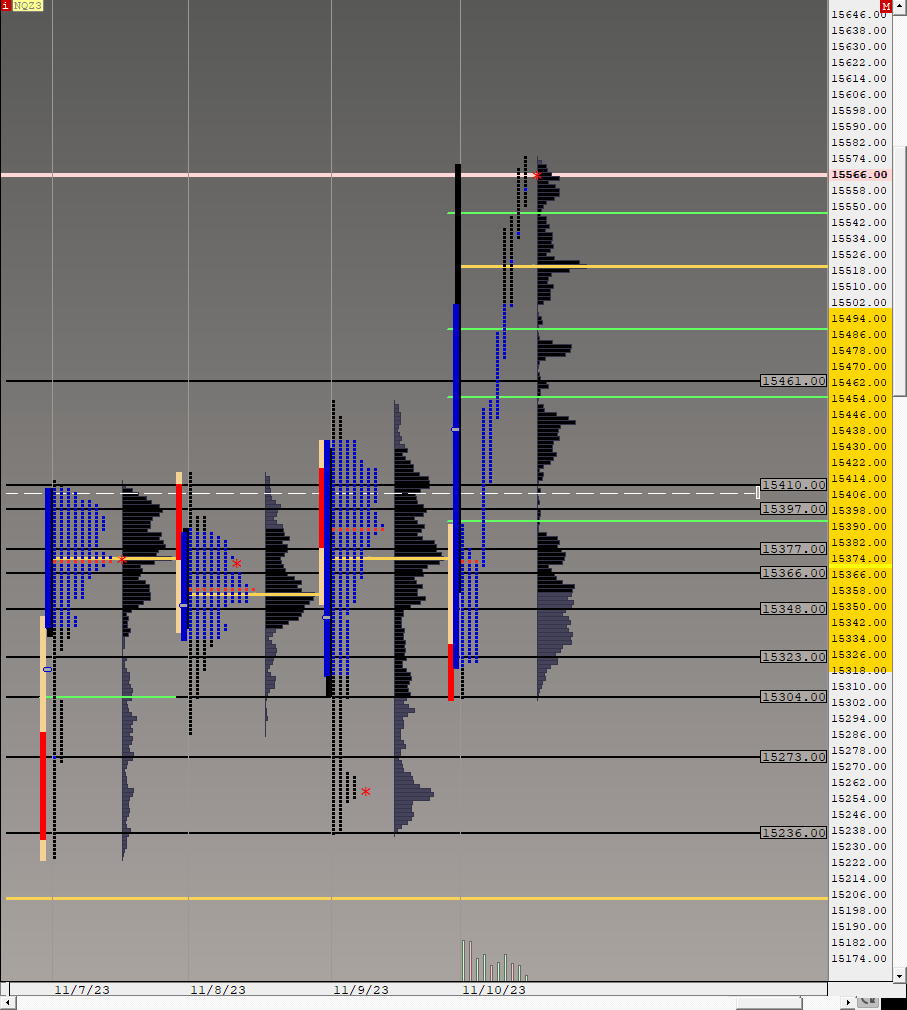 |
OrderFlowNQ Day (NQZ3) ES42 [totalcount]
6 months 1 week ago
This chart was uploaded by Investor/RT 15.1.16 showing symbol: NQZ3. |
View |
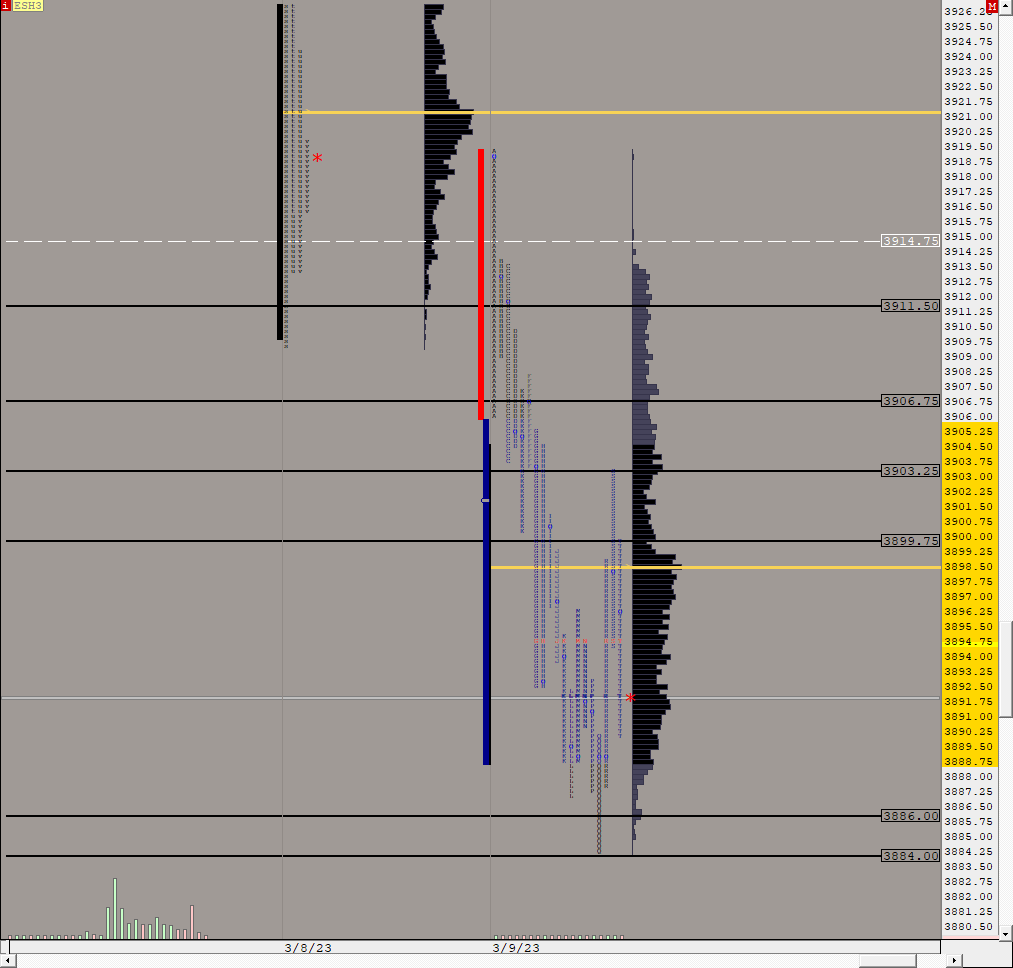 |
ES Globex Daily Open only (ESH3) ES42 [totalcount]
1 year 2 months ago
This chart was uploaded by Investor/RT 14.5.4 showing symbol: ESH3. |
View |
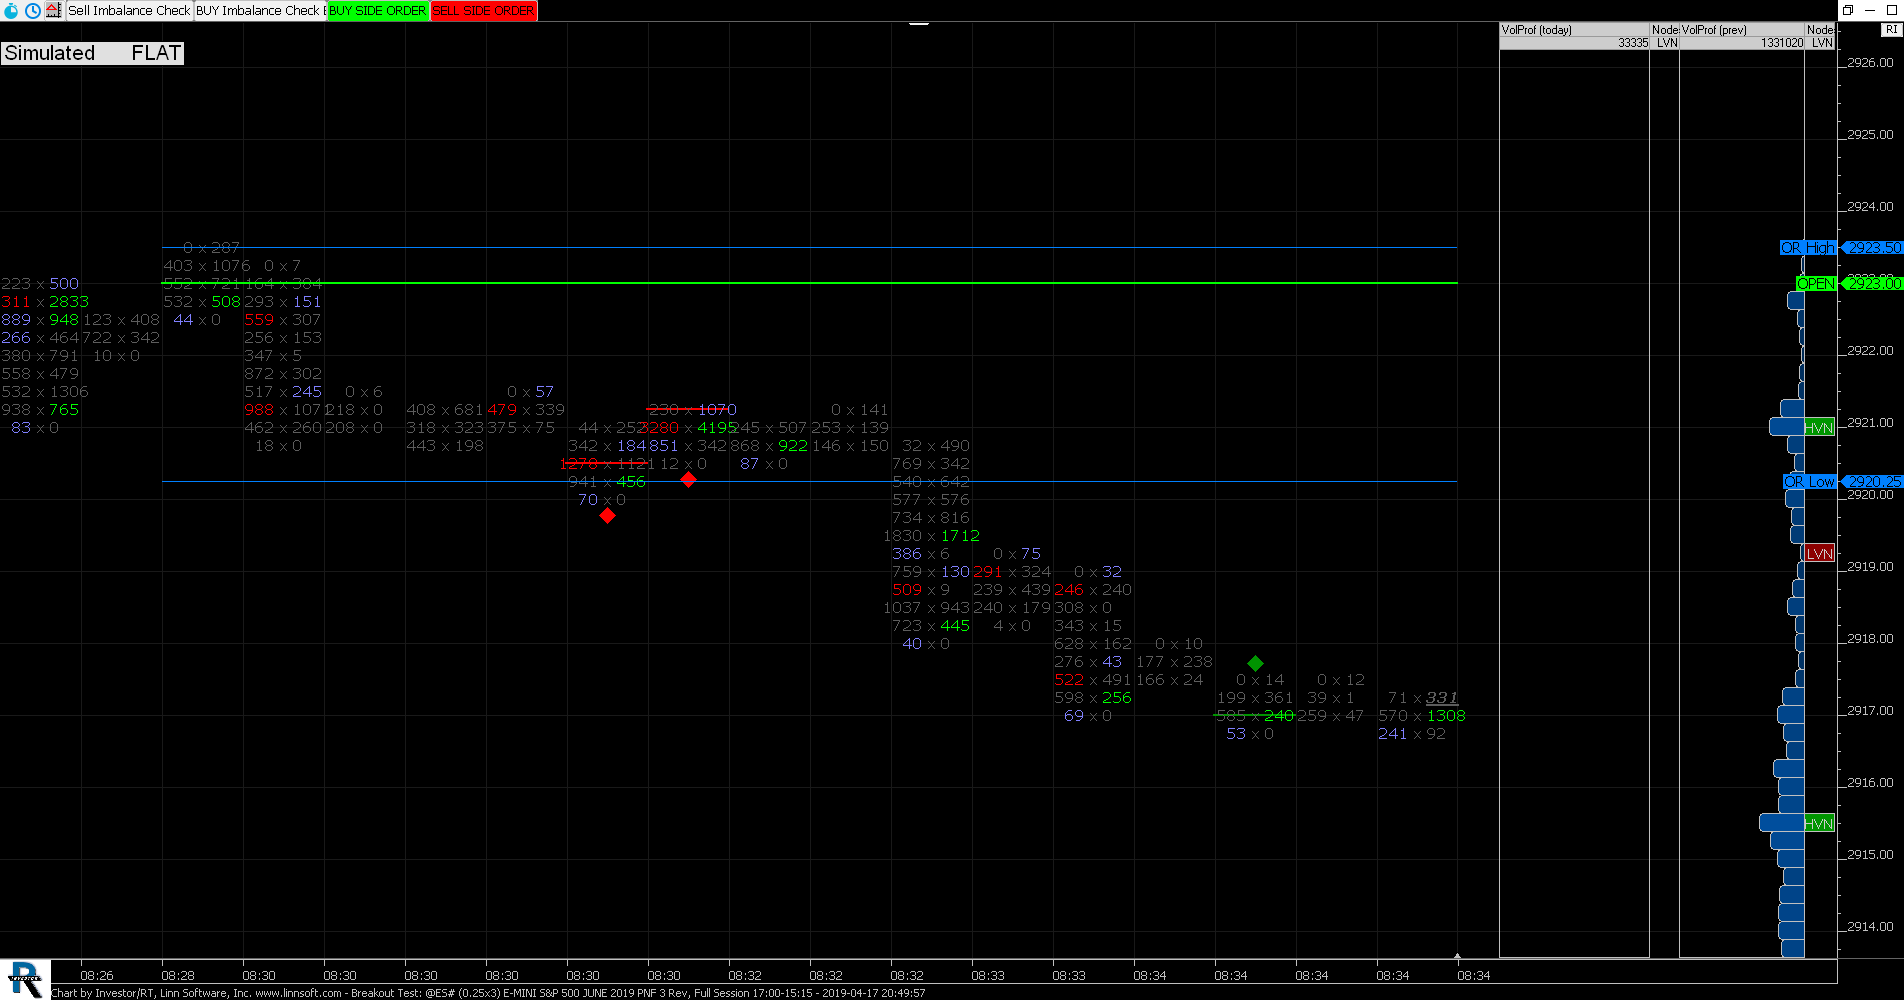 |
Breakout Test (@ES#) joseph-j-helminiak [totalcount]
5 years 1 month ago
ES OR Breakout trade w/VolumeScope AND Imbalance. This chart was uploaded by Investor/RT 13.5.24 showing symbol: @ES#. |
View |
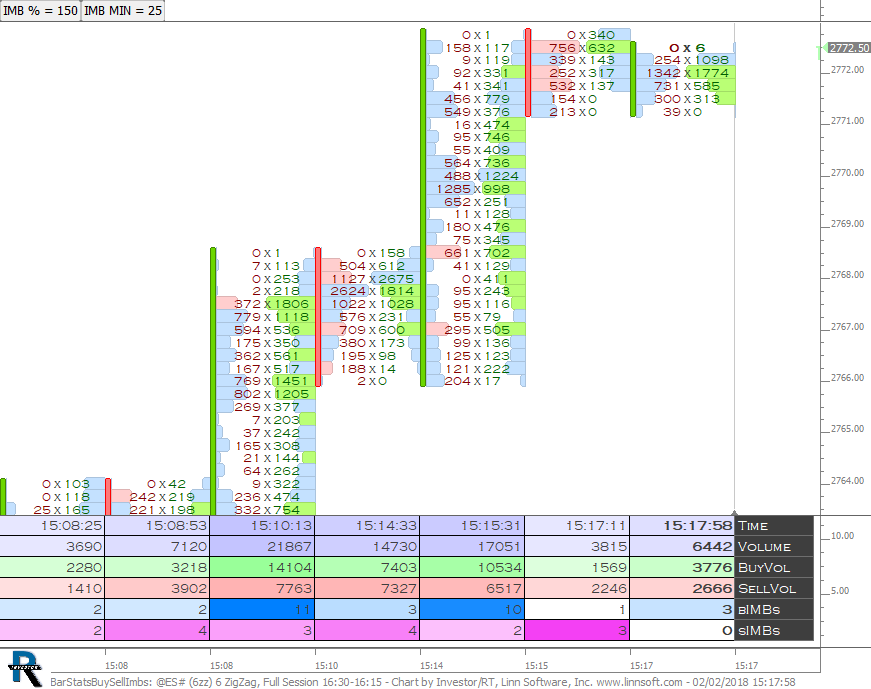 |
BarStatsBuySellImbs (@ES#) cpayne [totalcount]
6 years 3 months ago
Buy and Sell Volume Imbalance Counts as Text in Bar Statistics. This chart was uploaded by Investor/RT 13.2.1 showing symbol: @ES#. |
View |
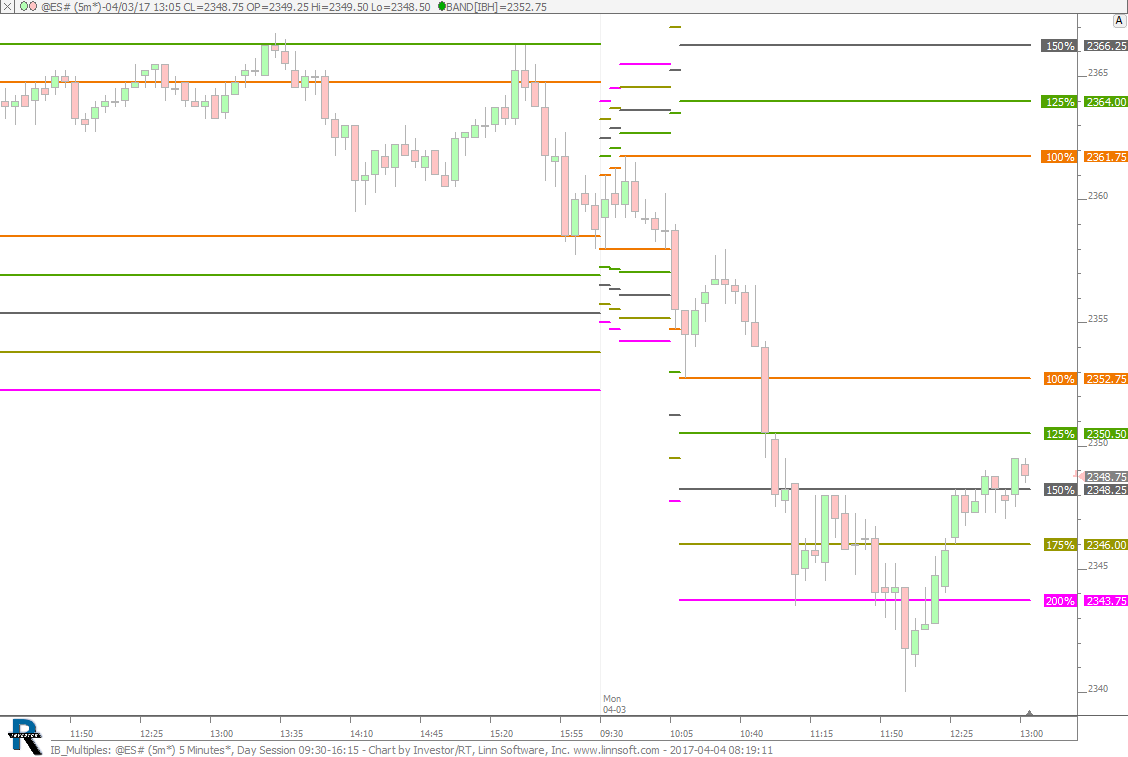 |
IB Multiples (@ES#) cpayne [totalcount]
7 years 1 month ago
Initial Balance Multiples using Bands Indicator. This chart was uploaded by Investor/RT 12.7.1 showing symbol: @ES#. |
View |
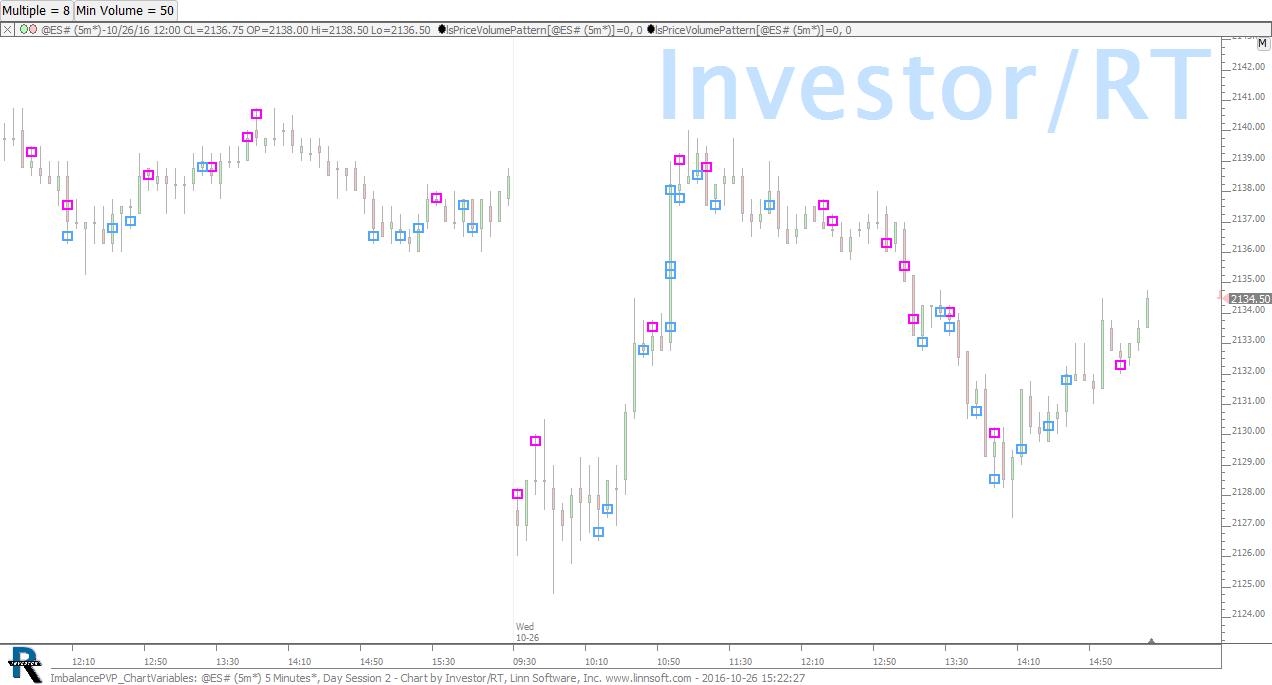 |
ImbalancePVP ChartVariables (@ES#) cpayne [totalcount]
7 years 6 months ago
Identifying Buying and Selling Volume Imbalance Using the Price Volume Pattern (PVP) RTX Indicator - And Using Chart Variables. |
View |
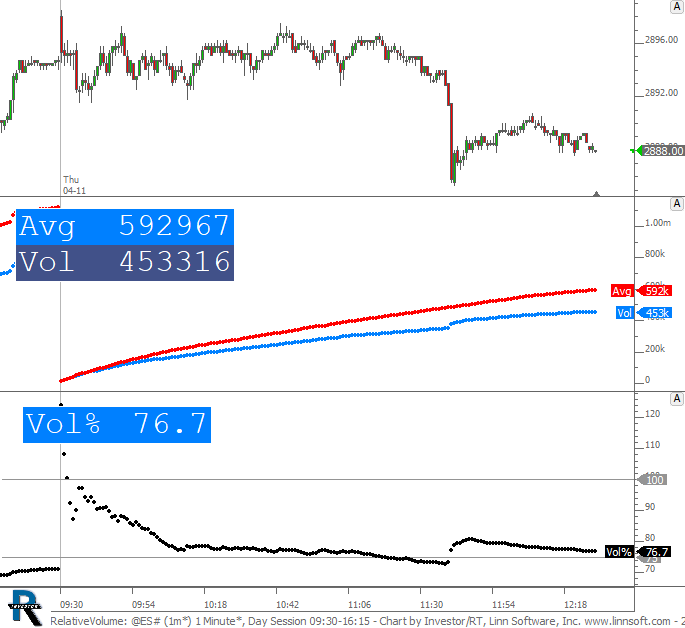 |
RelativeVolume (@ES#) cpayne [totalcount]
5 years 1 month ago
Relative Volume - Lower pane shows what percent of average volume we've achieved at each minute of the session. |
View |
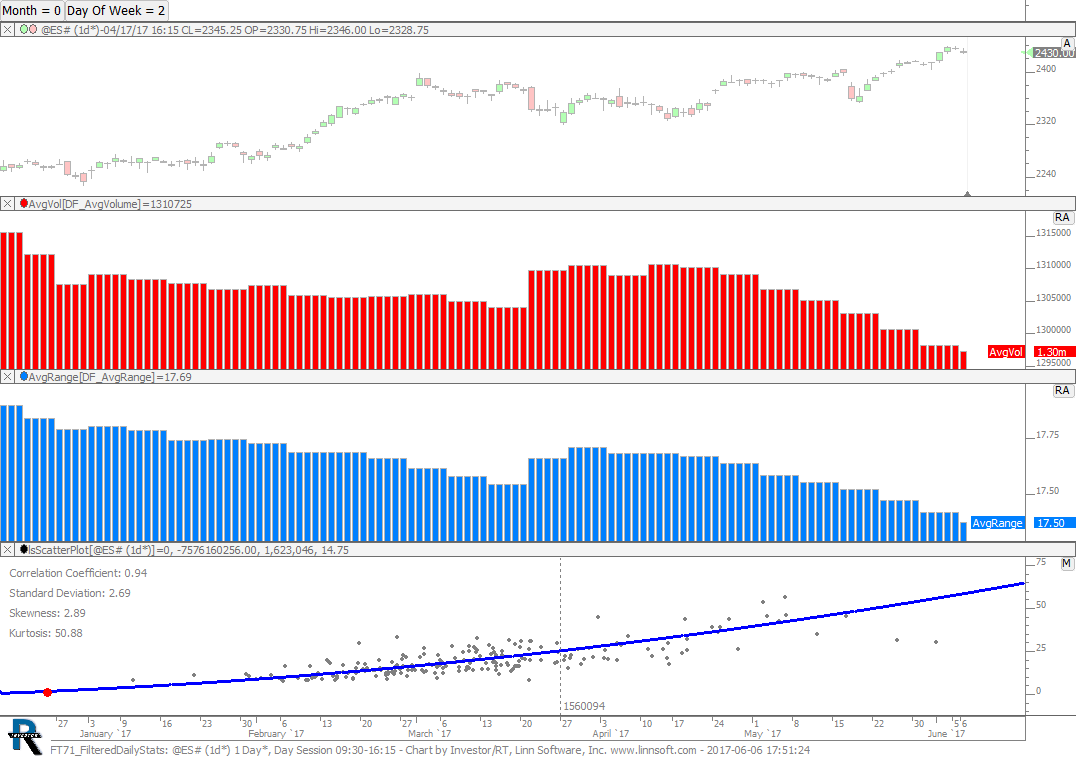 |
FT71 FilteredDailyStats (@ES#) cpayne [totalcount]
6 years 11 months ago
Filtered Data Statistics chart used in FuturesTrader71 Webinar on June 6, 2017. This chart was uploaded by Investor/RT 12.7.5 showing symbol: @ES#. |
View |
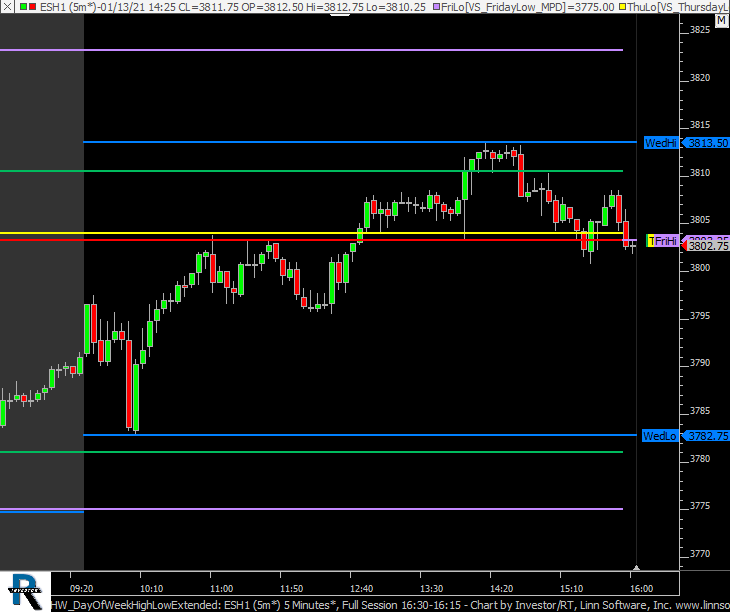 |
HW DayOfWeekHighLowExtended (ESH1) cpayne [totalcount]
3 years 4 months ago
The day session high and low of each day of the week is extended through the week until it resets on same day of week on following week. |
View |
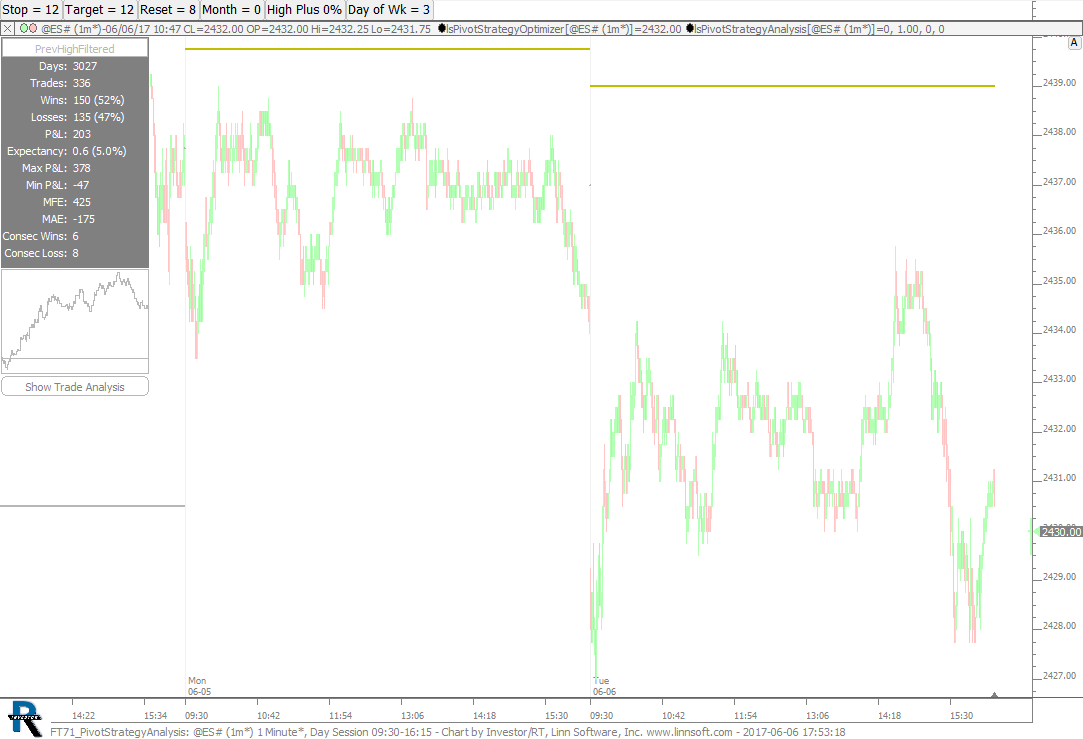 |
FT71 PivotStrategyAnalysis (@ES#) cpayne [totalcount]
6 years 11 months ago
PivotStrategyAnalysis and PivotStrategyOptimizer chart used in FuturesTrader71 Webinar on June 6, 2017. This chart was uploaded by Investor/RT 12.7.5 showing symbol: @ES#. |
View |
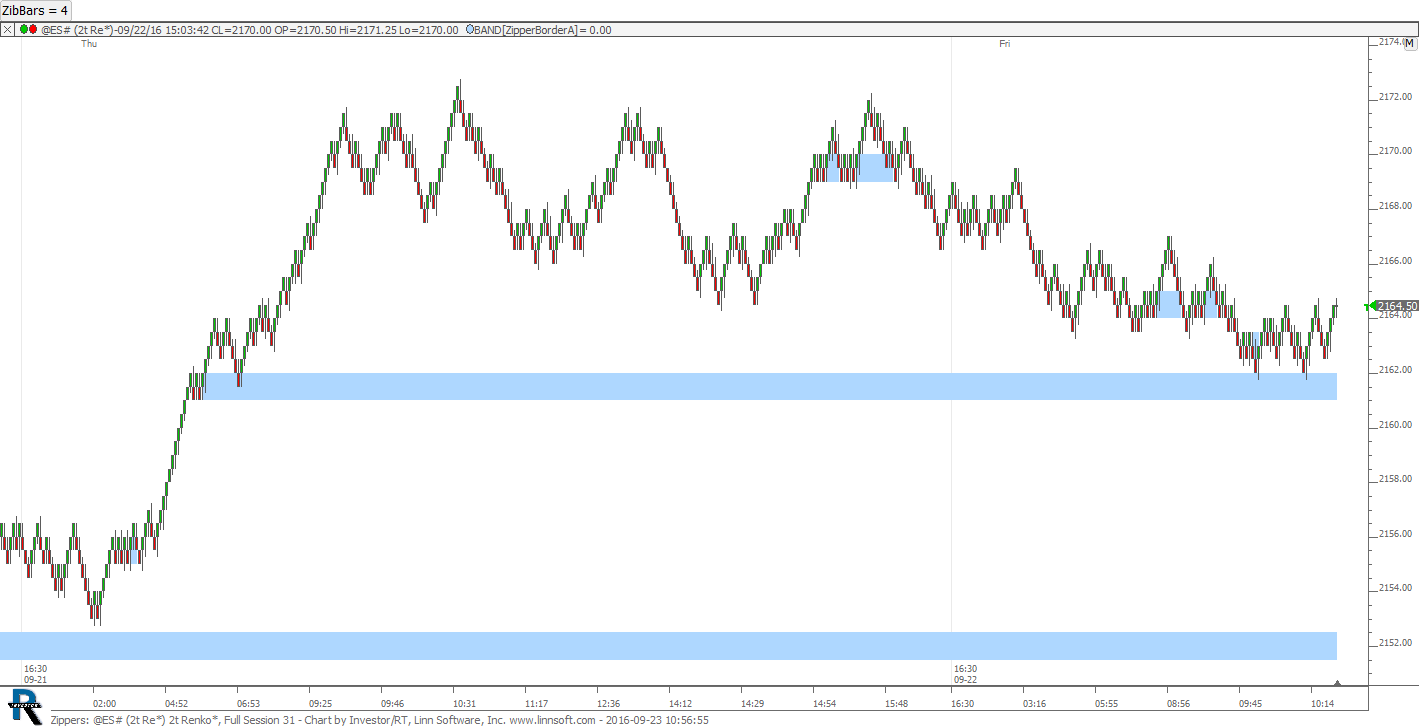 |
Zippers (@ES#) cpayne [totalcount]
7 years 8 months ago
Zipper Bars. This chart was uploaded by Investor/RT 12.6.2 showing symbol: @ES#. |
View |
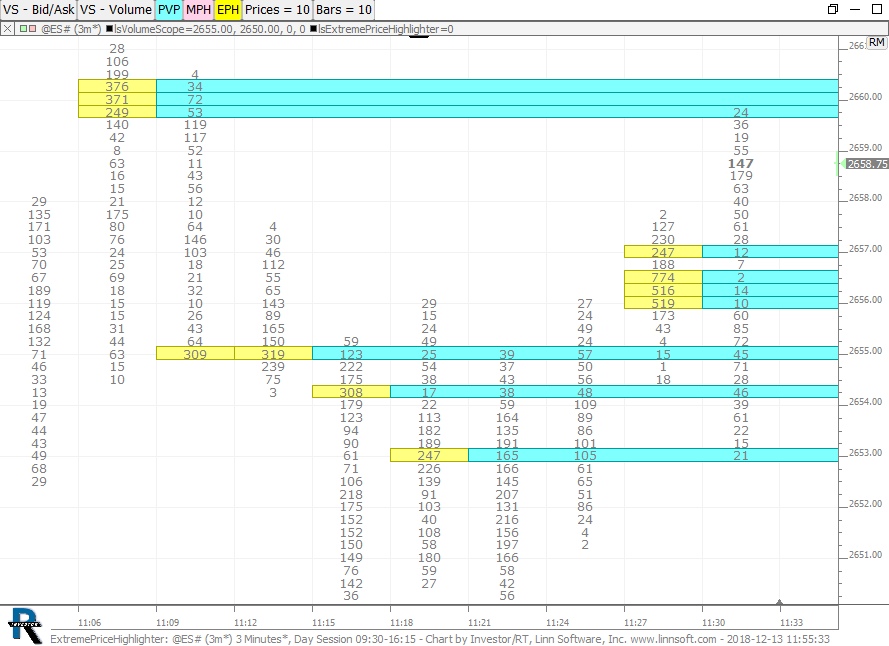 |
ExtremePriceHighlighter (@ES#) cpayne [totalcount]
5 years 5 months ago
ExtremPriceHighlighter. This chart was uploaded by Investor/RT 13.5.12 showing symbol: @ES#. |
View |
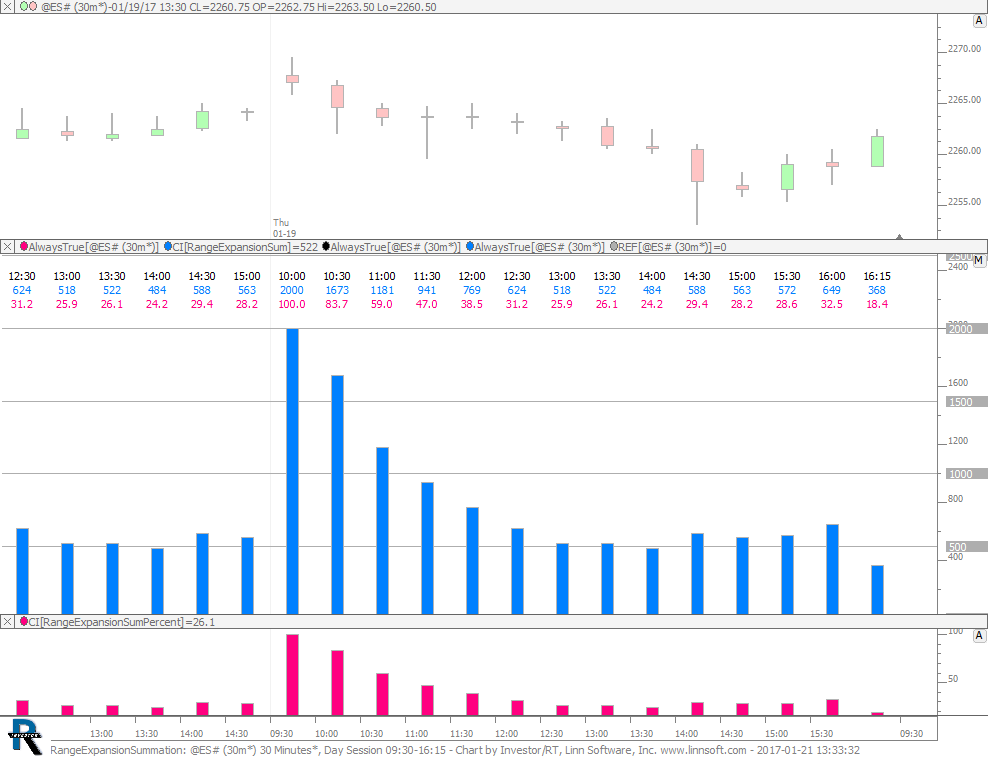 |
RangeExpansionSummation (@ES#) cpayne [totalcount]
7 years 3 months ago
Range Expansion Summation. This chart was uploaded by Investor/RT 12.7.1 showing symbol: @ES#. |
View |
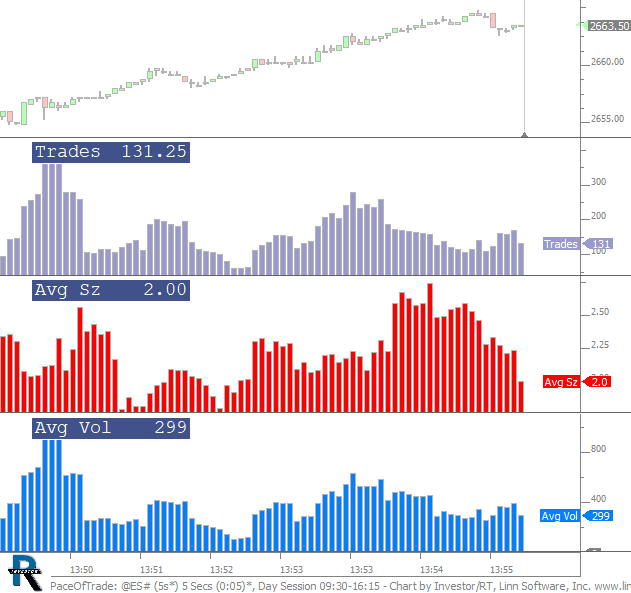 |
PaceOfTrade (@ES#) cpayne [totalcount]
6 years 3 months ago
Pace of Trade. Number of Trades, Volume, and Average Size of last 30 seconds (6 5-sec bars). Trades (purple), Avg Size (red) and Avg Volume (blue). |
View |