Coloring Lines & Histograms
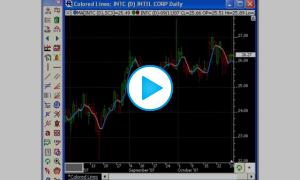
This video demonstrates how to color line and histogram-style indicators different colors based on various conditions.
This video demonstrates how to color line and histogram-style indicators different colors based on various conditions.
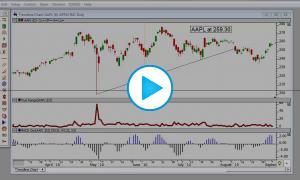
This video demonstrates how to quickly change the color, width, or style of indicator lines quickly from a pop-up menu.
This video demonstrates how to color line and histogram-style indicators different colors based on various conditions.
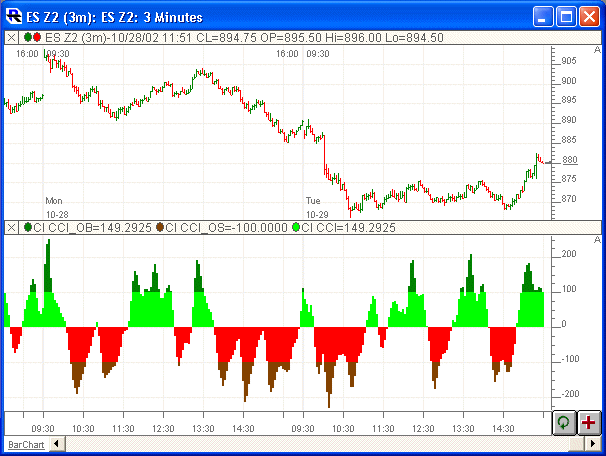
This Tutorial will demonstrate how to color extreme levels of histograms, as seen in the chart above. It will cover the following topics.
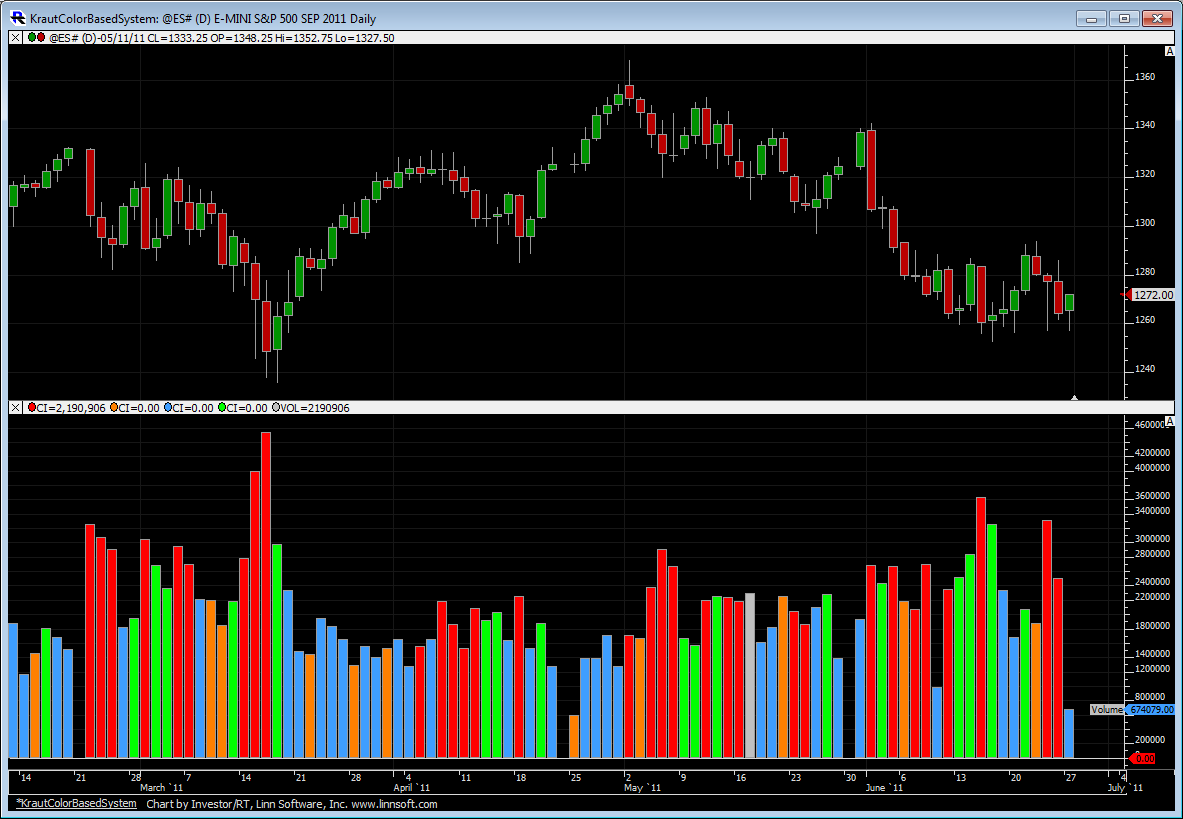
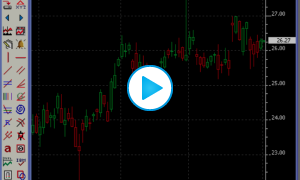
This chart contains the Kraut Color-Based system for short term trading, discussed in the Trader's Tips section of the July 2011 issue of TASC magazine. Volume bars are painted as follows.
If today's close and volume are greater than 2 weeks ago, color green
If today's close is greater and volume is less than 2 weeks ago, color blue
If today's close and volume are less than 2 weeks ago, color orange
If today's close is less and volume is greater than 2 weeks ago, color red
This video demonstrates how to quickly change the color, width, or style of indicator lines from a pop-up menu.