Divergence (RTX) Introduction
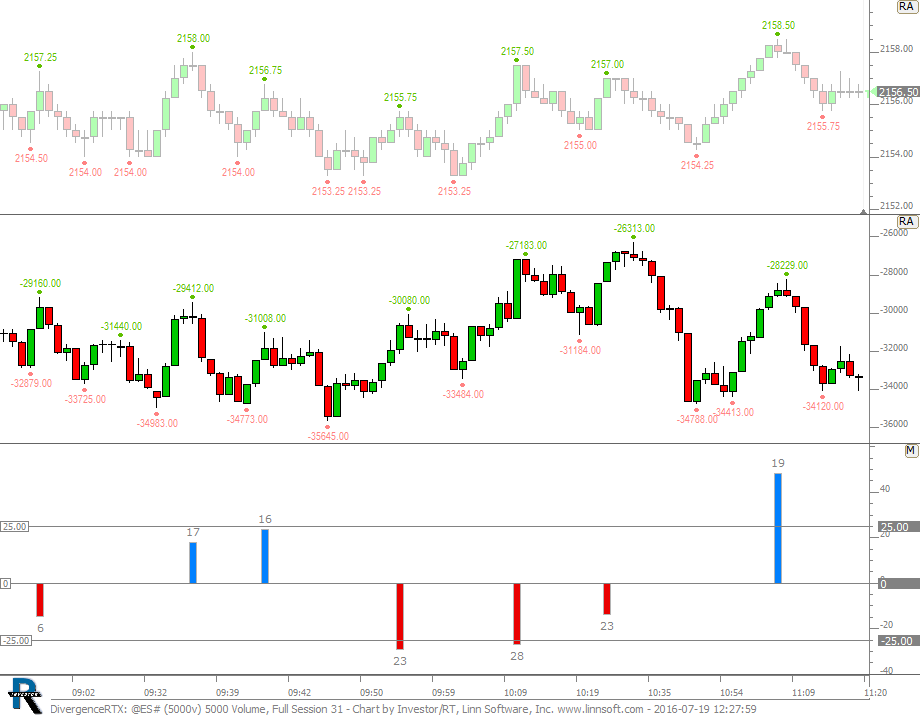
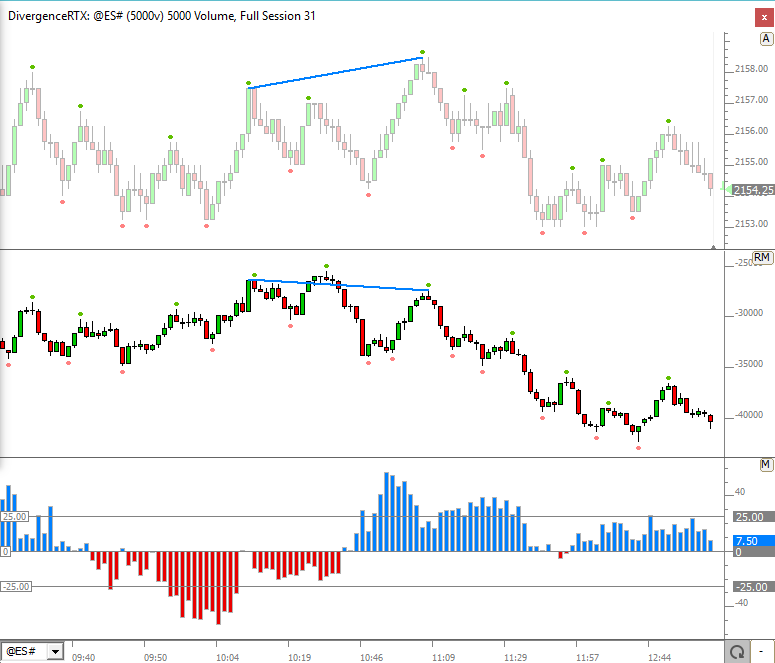
The Divergence RTX indicator quantifies divergence with a numerical value between two data series using various methods. Each data series may consistent of either price data, cumulative delta filtered, filtered cumulative delta, or any other indicator available in Investor/RT. In measuring divergence, we seek to identify strength in one data series relative to another data series at any given time. The indicator provides a variety of methods for computing divergence: Retracement, Percent Change, High to High, and Low to Low.